29
/it/
it
AIzaSyAYiBZKx7MnpbEhh9jyipgxe19OcubqV5w
April 1, 2024
247435
Spain
ESP
true
2
1
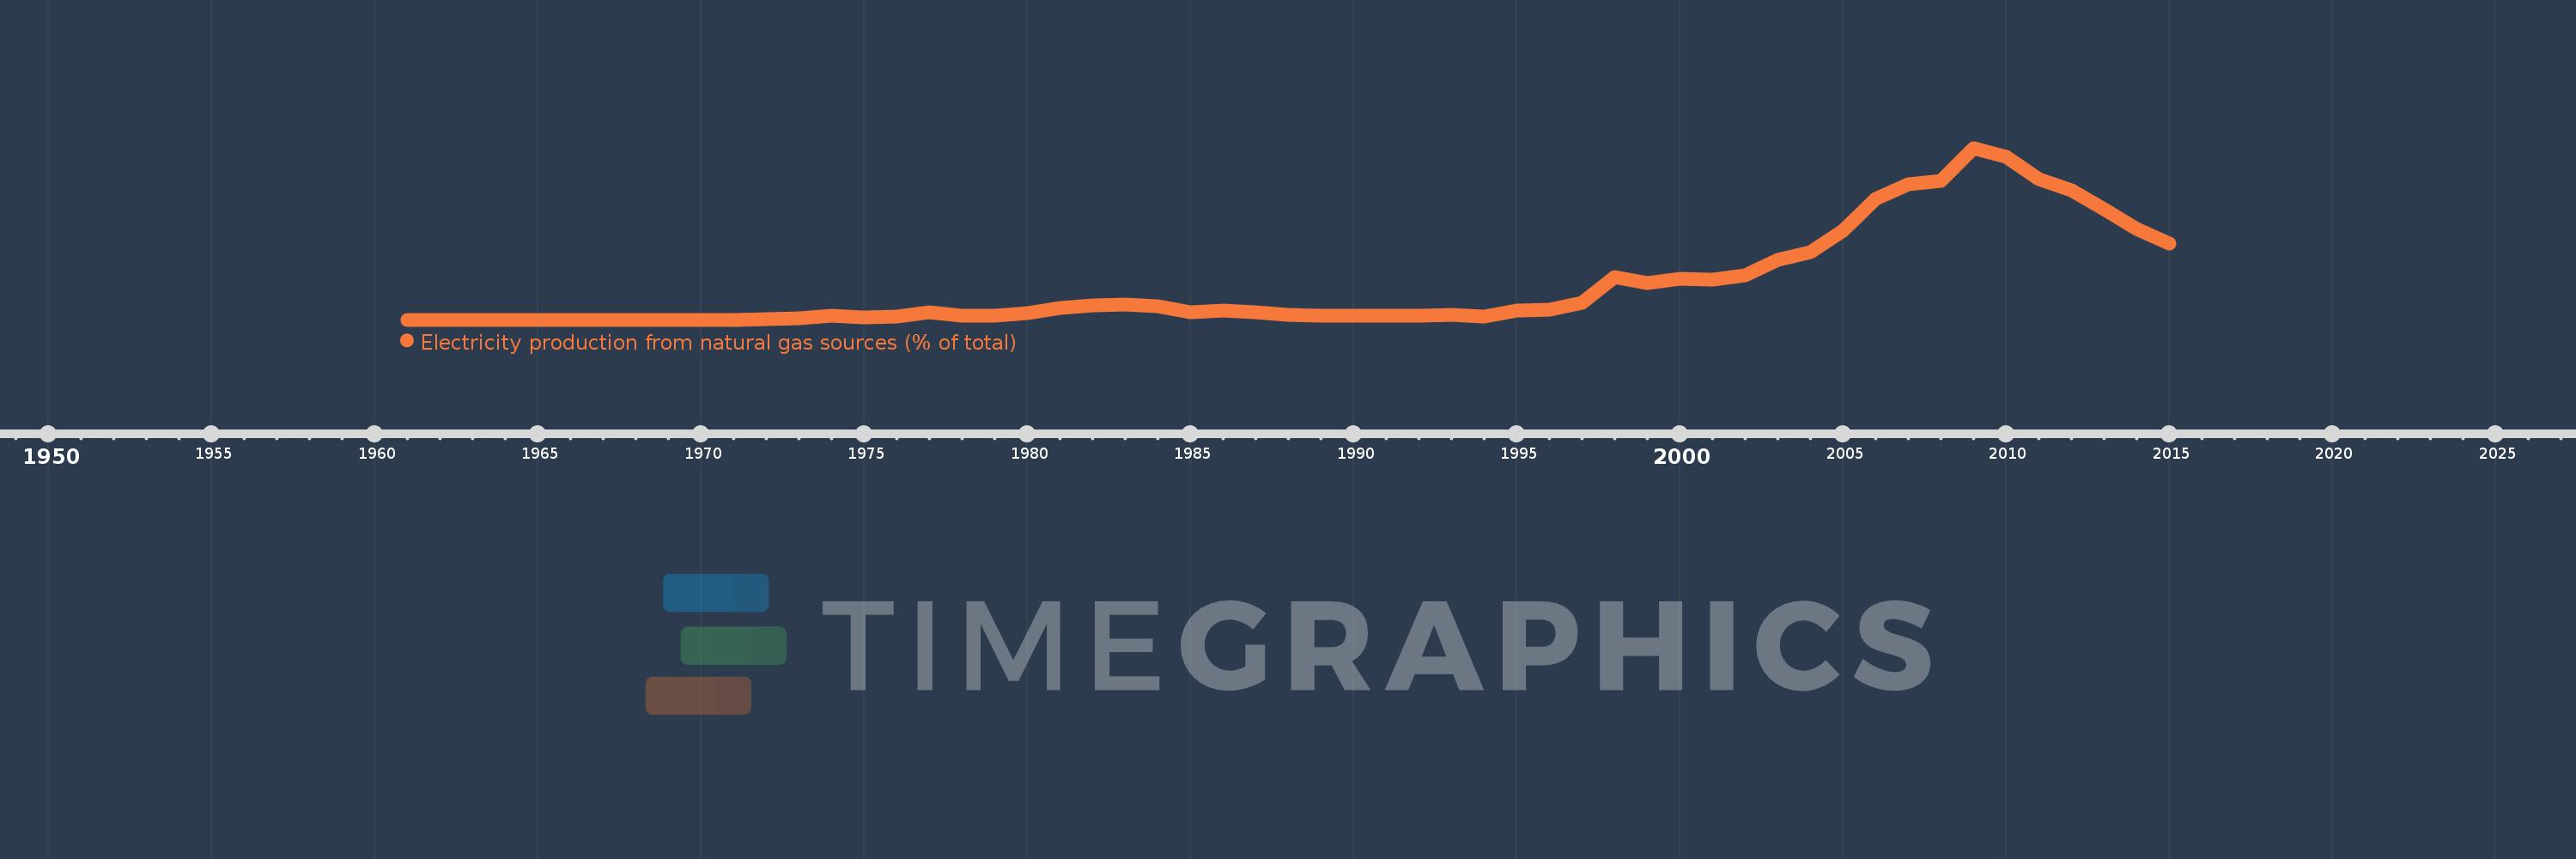
Electricity production from natural gas sources (% of total)
2015,2014,2013,2012,2011,2010,2009,2008,2007,2006,2005,2004,2003,2002,2001,2000,1999,1998,1997,1996,1995,1994,1993,1992,1991,1990,1989,1988,1987,1986,1985,1984,1983,1982,1981,1980,1979,1978,1977,1976,1975,1974,1973,1972,1971,1970,1969,1968,1967,1966,1965,1964,1963,1962,1961
Queste statistiche in altri paesi:
AlbaniaAlgeriaAngolaArab WorldArgentinaArmeniaAustraliaAustriaAzerbaijanBahrainBangladeshBelarusBelgiumBeninBoliviaBosnia and HerzegovinaBotswanaBrazilBrunei DarussalamBulgariaCambodiaCameroonCanadaCentral Europe and the BalticsChileChinaColombiaCongo, Dem. Rep.Congo, Rep.Costa RicaCote d'IvoireCroatiaCubaCuracaoCyprusCzech RepublicDenmarkDominican RepublicEarly-demographic dividendEast Asia & PacificEast Asia & Pacific (excluding high income)East Asia & Pacific (IDA & IBRD countries)EcuadorEgypt, Arab Rep.El SalvadorEritreaEstoniaEthiopiaEuro areaEurope & Central AsiaEurope & Central Asia (excluding high income)Europe & Central Asia (IDA & IBRD countries)European UnionFinlandFragile and conflict affected situationsFranceGabonGeorgiaGermanyGhanaGibraltarGreeceGuatemalaHaitiHeavily indebted poor countries (HIPC)High incomeHondurasHong Kong SAR, ChinaHungaryIBRD onlyIcelandIDA & IBRD totalIDA blendIDA onlyIDA totalIndiaIndonesiaIran, Islamic Rep.IraqIrelandIsraelItalyJamaicaJapanJordanKazakhstanKenyaKorea, Dem. People’s Rep.Korea, Rep.KosovoKuwaitKyrgyz RepublicLate-demographic dividendLatin America & Caribbean Latin America & Caribbean (excluding high income)Latin America & the Caribbean (IDA & IBRD countries)LatviaLeast developed countries: UN classificationLebanonLibyaLithuaniaLow & middle incomeLower middle incomeLuxembourgMacedonia, FYRMalaysiaMaltaMauritiusMexicoMiddle East & North AfricaMiddle East & North Africa (excluding high income)Middle East & North Africa (IDA & IBRD countries)Middle incomeMoldovaMongoliaMontenegroMoroccoMozambiqueMyanmarNamibiaNepalNetherlandsNew ZealandNicaraguaNigerNigeriaNorth AmericaNorwayOECD membersOmanOther small statesPakistanPanamaParaguayPeruPhilippinesPolandPortugalPost-demographic dividendPre-demographic dividendQatarRomaniaRussian FederationSaudi ArabiaSenegalSerbiaSingaporeSlovak RepublicSloveniaSmall statesSouth AfricaSouth AsiaSouth Asia (IDA & IBRD)South SudanSpainSri LankaSub-Saharan Africa Sub-Saharan Africa (excluding high income)Sub-Saharan Africa (IDA & IBRD countries)SudanSwedenSwitzerlandSyrian Arab RepublicTajikistanTanzaniaThailandTogoTrinidad and TobagoTunisiaTurkeyTurkmenistanUkraineUnited Arab EmiratesUnited KingdomUnited StatesUpper middle incomeUruguayUzbekistanVenezuela, RBVietnamWorldYemen, Rep.ZambiaZimbabwe Linea del tempo:
Questa scala temporale mostra un grafico dal 1961 anno al 2015 anno. Spain. I dati fino ad 1960 anno non disponibili. Il numero di osservazioni attuali secondo i date: 55.
La fonte (nome):
Indicatori dello sviluppo mondiale
La fonte (organizzazione):
IEA Statistics © OECD/IEA 2014 (http://www.iea.org/stats/index.asp), subject to https://www.iea.org/t&c/termsandconditions/
Categorie:
Energy & Mining, Climate Change, Infrastructure
sono stati aggiornati
23 apr 2017 anni
Indicatori delle variazioni dei valori per anni
Minima:
0.0
1 gen 1961 anni
Massimo:
38.845
1 gen 2009 anni
Alla data di osservazione
Valore
Variazione assoluta
La variazione rispetto al valore precedente
1 gen 1961 anni
0.0
0.0
0.0%
1 gen 1970 anni
0.019
+0.019
%
1 gen 1971 anni
0.005
-0.014
-72.27%
1 gen 1972 anni
0.182
+0.177
3.31 Mille.%
1 gen 1973 anni
0.284
+0.102
56.26%
1 gen 1974 anni
1.006
+0.722
253.94%
1 gen 1975 anni
0.553
-0.453
-45.0%
1 gen 1976 anni
0.736
+0.182
32.99%
1 gen 1977 anni
1.757
+1.021
138.81%
1 gen 1978 anni
0.99
-0.767
-43.63%
1 gen 1979 anni
0.854
-0.137
-13.81%
1 gen 1980 anni
1.461
+0.608
71.19%
1 gen 1981 anni
2.667
+1.206
82.51%
1 gen 1982 anni
3.327
+0.66
24.76%
1 gen 1983 anni
3.401
+0.073
2.2%
1 gen 1984 anni
3.022
-0.378
-11.13%
1 gen 1985 anni
1.748
-1.275
-42.18%
1 gen 1986 anni
2.001
+0.254
14.52%
1 gen 1987 anni
1.652
-0.35
-17.47%
1 gen 1988 anni
1.128
-0.524
-31.7%
1 gen 1989 anni
0.985
-0.143
-12.69%
1 gen 1990 anni
0.95
-0.035
-3.58%
1 gen 1991 anni
0.998
+0.048
5.08%
1 gen 1992 anni
0.879
-0.118
-11.87%
1 gen 1993 anni
1.092
+0.212
24.15%
1 gen 1994 anni
0.769
-0.322
-29.53%
1 gen 1995 anni
2.007
+1.237
160.82%
1 gen 1996 anni
2.265
+0.258
12.84%
1 gen 1997 anni
3.903
+1.639
72.37%
1 gen 1998 anni
9.608
+5.705
146.16%
1 gen 1999 anni
8.383
-1.225
-12.75%
1 gen 2000 anni
9.259
+0.876
10.45%
1 gen 2001 anni
9.134
-0.125
-1.35%
1 gen 2002 anni
10.022
+0.888
9.73%
1 gen 2003 anni
13.499
+3.477
34.69%
1 gen 2004 anni
15.3
+1.801
13.34%
1 gen 2005 anni
20.047
+4.747
31.03%
1 gen 2006 anni
27.297
+7.251
36.17%
1 gen 2007 anni
30.641
+3.344
12.25%
1 gen 2008 anni
31.407
+0.766
2.5%
1 gen 2009 anni
38.845
+7.437
23.68%
1 gen 2010 anni
36.916
-1.929
-4.97%
1 gen 2011 anni
31.795
-5.121
-13.87%
1 gen 2012 anni
29.33
-2.465
-7.75%
1 gen 2013 anni
24.94
-4.391
-14.97%
1 gen 2014 anni
20.444
-4.496
-18.03%
1 gen 2015 anni
17.22
-3.224
-15.77%
Classificazione dei paesi secondo i statistiche attuali per anni


Commenti: