29
/it/
it
AIzaSyAYiBZKx7MnpbEhh9jyipgxe19OcubqV5w
April 1, 2024
100987
Canada
CAN
true
2
1
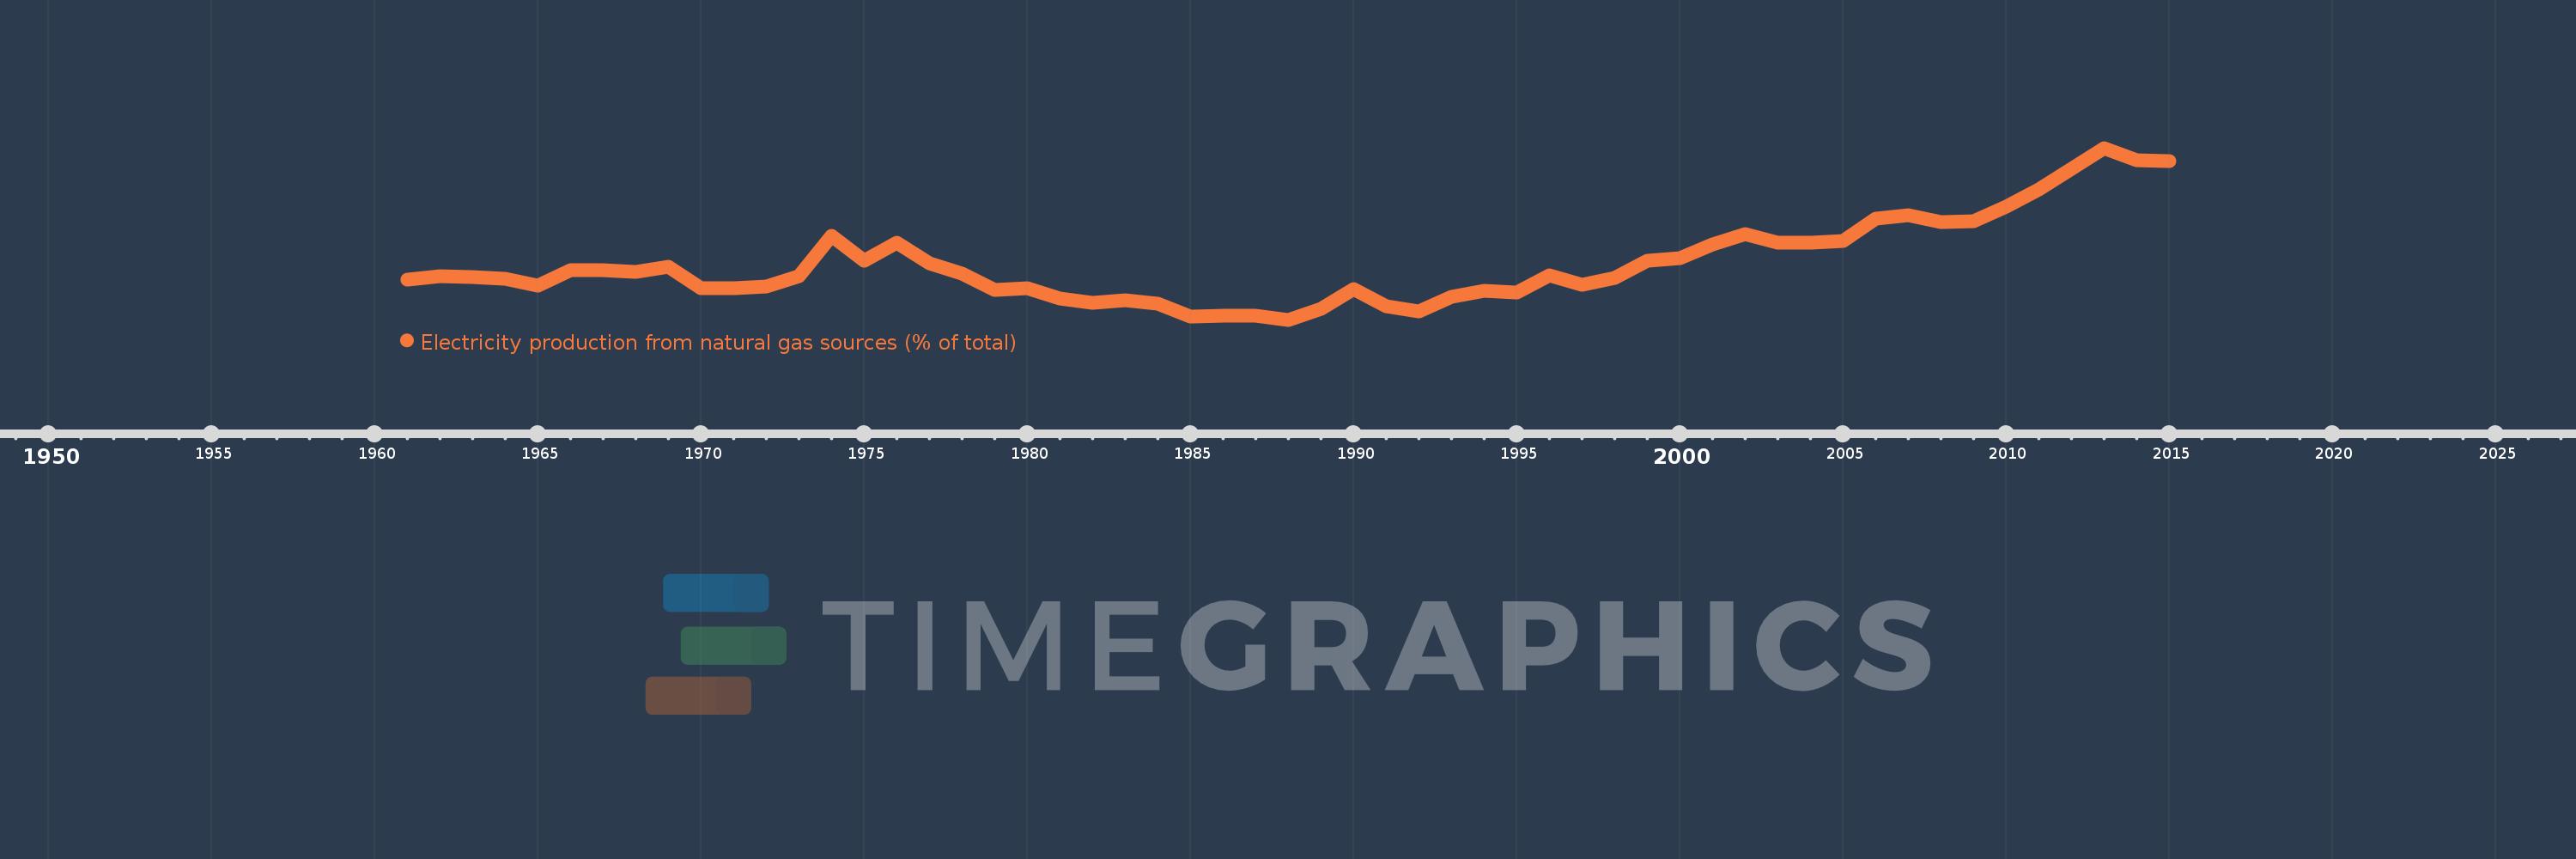
Electricity production from natural gas sources (% of total)
2015,2014,2013,2012,2011,2010,2009,2008,2007,2006,2005,2004,2003,2002,2001,2000,1999,1998,1997,1996,1995,1994,1993,1992,1991,1990,1989,1988,1987,1986,1985,1984,1983,1982,1981,1980,1979,1978,1977,1976,1975,1974,1973,1972,1971,1970,1969,1968,1967,1966,1965,1964,1963,1962,1961
Queste statistiche in altri paesi:
AlbaniaAlgeriaAngolaArab WorldArgentinaArmeniaAustraliaAustriaAzerbaijanBahrainBangladeshBelarusBelgiumBeninBoliviaBosnia and HerzegovinaBotswanaBrazilBrunei DarussalamBulgariaCambodiaCameroonCanadaCentral Europe and the BalticsChileChinaColombiaCongo, Dem. Rep.Congo, Rep.Costa RicaCote d'IvoireCroatiaCubaCuracaoCyprusCzech RepublicDenmarkDominican RepublicEarly-demographic dividendEast Asia & PacificEast Asia & Pacific (excluding high income)East Asia & Pacific (IDA & IBRD countries)EcuadorEgypt, Arab Rep.El SalvadorEritreaEstoniaEthiopiaEuro areaEurope & Central AsiaEurope & Central Asia (excluding high income)Europe & Central Asia (IDA & IBRD countries)European UnionFinlandFragile and conflict affected situationsFranceGabonGeorgiaGermanyGhanaGibraltarGreeceGuatemalaHaitiHeavily indebted poor countries (HIPC)High incomeHondurasHong Kong SAR, ChinaHungaryIBRD onlyIcelandIDA & IBRD totalIDA blendIDA onlyIDA totalIndiaIndonesiaIran, Islamic Rep.IraqIrelandIsraelItalyJamaicaJapanJordanKazakhstanKenyaKorea, Dem. People’s Rep.Korea, Rep.KosovoKuwaitKyrgyz RepublicLate-demographic dividendLatin America & Caribbean Latin America & Caribbean (excluding high income)Latin America & the Caribbean (IDA & IBRD countries)LatviaLeast developed countries: UN classificationLebanonLibyaLithuaniaLow & middle incomeLower middle incomeLuxembourgMacedonia, FYRMalaysiaMaltaMauritiusMexicoMiddle East & North AfricaMiddle East & North Africa (excluding high income)Middle East & North Africa (IDA & IBRD countries)Middle incomeMoldovaMongoliaMontenegroMoroccoMozambiqueMyanmarNamibiaNepalNetherlandsNew ZealandNicaraguaNigerNigeriaNorth AmericaNorwayOECD membersOmanOther small statesPakistanPanamaParaguayPeruPhilippinesPolandPortugalPost-demographic dividendPre-demographic dividendQatarRomaniaRussian FederationSaudi ArabiaSenegalSerbiaSingaporeSlovak RepublicSloveniaSmall statesSouth AfricaSouth AsiaSouth Asia (IDA & IBRD)South SudanSpainSri LankaSub-Saharan Africa Sub-Saharan Africa (excluding high income)Sub-Saharan Africa (IDA & IBRD countries)SudanSwedenSwitzerlandSyrian Arab RepublicTajikistanTanzaniaThailandTogoTrinidad and TobagoTunisiaTurkeyTurkmenistanUkraineUnited Arab EmiratesUnited KingdomUnited StatesUpper middle incomeUruguayUzbekistanVenezuela, RBVietnamWorldYemen, Rep.ZambiaZimbabwe Linea del tempo:
Questa scala temporale mostra un grafico dal 1961 anno al 2015 anno. Canada. I dati fino ad 1960 anno non disponibili. Il numero di osservazioni attuali secondo i date: 55.
La fonte (nome):
Indicatori dello sviluppo mondiale
La fonte (organizzazione):
IEA Statistics © OECD/IEA 2014 (http://www.iea.org/stats/index.asp), subject to https://www.iea.org/t&c/termsandconditions/
Categorie:
Energy & Mining, Climate Change, Infrastructure
sono stati aggiornati
23 apr 2017 anni
Indicatori delle variazioni dei valori per anni
Minima:
1.241
1 gen 1988 anni
Massimo:
10.993
1 gen 2013 anni
Alla data di osservazione
Valore
Variazione assoluta
La variazione rispetto al valore precedente
1 gen 1961 anni
3.504
+3.504
0.0%
1 gen 1962 anni
3.727
+0.222
6.35%
1 gen 1963 anni
3.681
-0.046
-1.22%
1 gen 1964 anni
3.546
-0.135
-3.68%
1 gen 1965 anni
3.171
-0.375
-10.58%
1 gen 1966 anni
4.066
+0.895
28.22%
1 gen 1967 anni
4.074
+0.008
0.19%
1 gen 1968 anni
3.935
-0.139
-3.41%
1 gen 1969 anni
4.251
+0.316
8.03%
1 gen 1970 anni
3.041
-1.21
-28.46%
1 gen 1971 anni
3.041
0.0
-0.01%
1 gen 1972 anni
3.145
+0.104
3.41%
1 gen 1973 anni
3.736
+0.591
18.8%
1 gen 1974 anni
5.998
+2.262
60.55%
1 gen 1975 anni
4.612
-1.386
-23.11%
1 gen 1976 anni
5.597
+0.985
21.35%
1 gen 1977 anni
4.462
-1.134
-20.26%
1 gen 1978 anni
3.844
-0.618
-13.85%
1 gen 1979 anni
2.928
-0.916
-23.83%
1 gen 1980 anni
3.048
+0.119
4.08%
1 gen 1981 anni
2.463
-0.585
-19.2%
1 gen 1982 anni
2.22
-0.242
-9.83%
1 gen 1983 anni
2.331
+0.111
5.0%
1 gen 1984 anni
2.156
-0.175
-7.51%
1 gen 1985 anni
1.4
-0.756
-35.05%
1 gen 1986 anni
1.484
+0.083
5.93%
1 gen 1987 anni
1.47
-0.014
-0.92%
1 gen 1988 anni
1.241
-0.229
-15.56%
1 gen 1989 anni
1.865
+0.624
50.24%
1 gen 1990 anni
2.97
+1.106
59.29%
1 gen 1991 anni
2.003
-0.967
-32.57%
1 gen 1992 anni
1.696
-0.307
-15.33%
1 gen 1993 anni
2.522
+0.826
48.74%
1 gen 1994 anni
2.875
+0.353
14.0%
1 gen 1995 anni
2.778
-0.097
-3.38%
1 gen 1996 anni
3.784
+1.006
36.21%
1 gen 1997 anni
3.206
-0.578
-15.28%
1 gen 1998 anni
3.627
+0.421
13.14%
1 gen 1999 anni
4.61
+0.983
27.11%
1 gen 2000 anni
4.735
+0.125
2.71%
1 gen 2001 anni
5.527
+0.792
16.73%
1 gen 2002 anni
6.101
+0.574
10.38%
1 gen 2003 anni
5.628
-0.472
-7.74%
1 gen 2004 anni
5.606
-0.022
-0.4%
1 gen 2005 anni
5.728
+0.122
2.17%
1 gen 2006 anni
6.978
+1.251
21.84%
1 gen 2007 anni
7.156
+0.178
2.55%
1 gen 2008 anni
6.807
-0.35
-4.89%
1 gen 2009 anni
6.829
+0.022
0.32%
1 gen 2010 anni
7.647
+0.818
11.98%
1 gen 2011 anni
8.618
+0.971
12.7%
1 gen 2012 anni
9.817
+1.199
13.92%
1 gen 2013 anni
10.993
+1.176
11.98%
1 gen 2014 anni
10.305
-0.688
-6.25%
1 gen 2015 anni
10.259
-0.046
-0.45%
Classificazione dei paesi secondo i statistiche attuali per anni


Commenti: