29
/it/
it
AIzaSyAYiBZKx7MnpbEhh9jyipgxe19OcubqV5w
April 1, 2024
62445
World
WLD
false
2
1
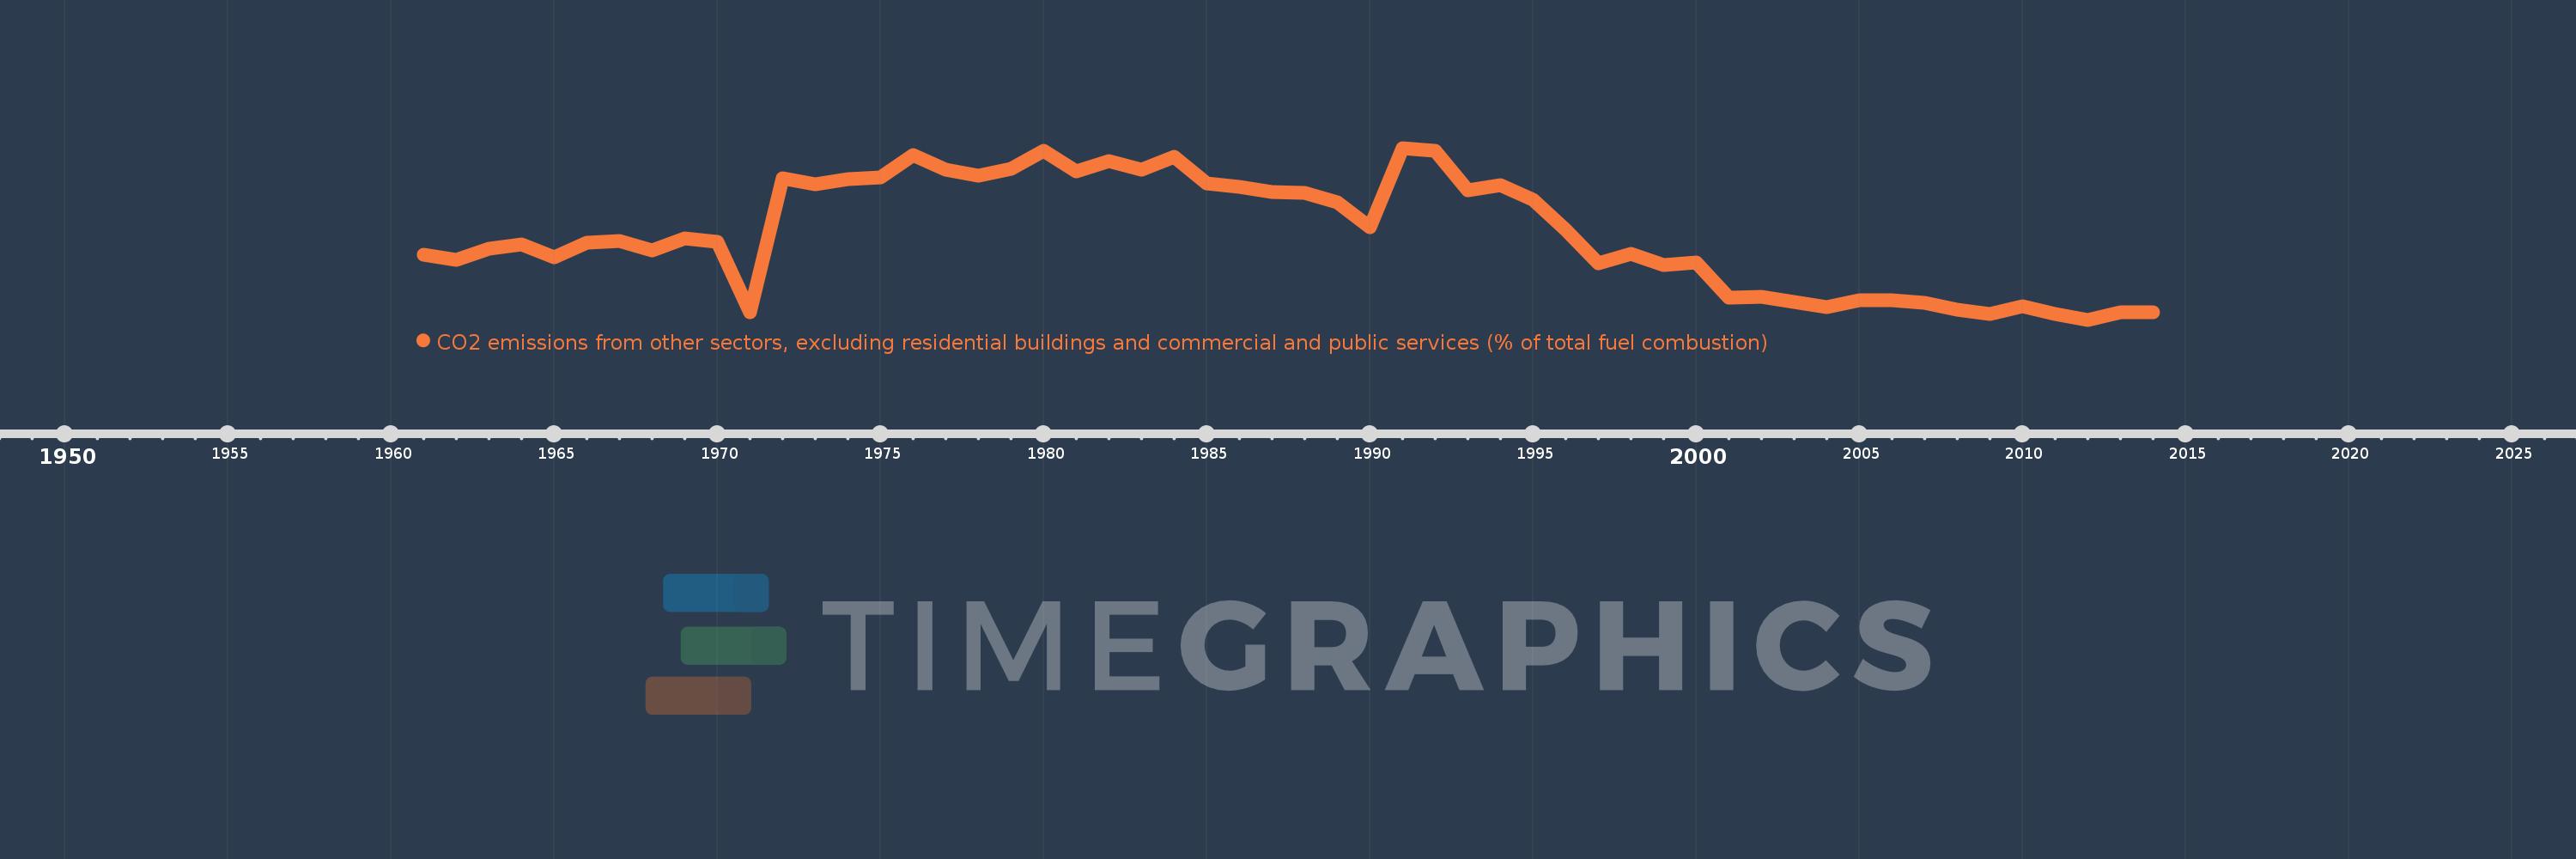
CO2 emissions from other sectors, excluding residential buildings and commercial and public services (% of total fuel combustion)
2014,2013,2012,2011,2010,2009,2008,2007,2006,2005,2004,2003,2002,2001,2000,1999,1998,1997,1996,1995,1994,1993,1992,1991,1990,1989,1988,1987,1986,1985,1984,1983,1982,1981,1980,1979,1978,1977,1976,1975,1974,1973,1972,1971,1970,1969,1968,1967,1966,1965,1964,1963,1962,1961
Queste statistiche in altri paesi:
AlbaniaAlgeriaAngolaArab WorldArgentinaArmeniaAustraliaAustriaAzerbaijanBahrainBangladeshBelarusBelgiumBeninBoliviaBosnia and HerzegovinaBotswanaBrazilBrunei DarussalamBulgariaCambodiaCameroonCanadaCaribbean small statesCentral Europe and the BalticsChileChinaColombiaCongo, Dem. Rep.Congo, Rep.Costa RicaCote d'IvoireCroatiaCubaCuracaoCyprusCzech RepublicDenmarkDominican RepublicEarly-demographic dividendEast Asia & PacificEast Asia & Pacific (excluding high income)East Asia & Pacific (IDA & IBRD countries)EcuadorEgypt, Arab Rep.El SalvadorEritreaEstoniaEthiopiaEuro areaEurope & Central AsiaEurope & Central Asia (excluding high income)Europe & Central Asia (IDA & IBRD countries)European UnionFinlandFragile and conflict affected situationsFranceGabonGeorgiaGermanyGhanaGibraltarGreeceGuatemalaHaitiHeavily indebted poor countries (HIPC)High incomeHondurasHong Kong SAR, ChinaHungaryIBRD onlyIcelandIDA & IBRD totalIDA blendIDA onlyIDA totalIndiaIndonesiaIran, Islamic Rep.IraqIrelandIsraelItalyJamaicaJapanJordanKazakhstanKenyaKorea, Dem. People’s Rep.Korea, Rep.KosovoKuwaitKyrgyz RepublicLate-demographic dividendLatin America & Caribbean Latin America & Caribbean (excluding high income)Latin America & the Caribbean (IDA & IBRD countries)LatviaLeast developed countries: UN classificationLebanonLibyaLithuaniaLow & middle incomeLow incomeLower middle incomeLuxembourgMacedonia, FYRMalaysiaMaltaMauritiusMexicoMiddle East & North AfricaMiddle East & North Africa (excluding high income)Middle East & North Africa (IDA & IBRD countries)Middle incomeMoldovaMongoliaMontenegroMoroccoMozambiqueMyanmarNamibiaNepalNetherlandsNew ZealandNicaraguaNigerNigeriaNorth AmericaNorwayOECD membersOmanOther small statesPakistanPanamaParaguayPeruPhilippinesPolandPortugalPost-demographic dividendPre-demographic dividendQatarRomaniaRussian FederationSaudi ArabiaSenegalSerbiaSingaporeSlovak RepublicSloveniaSmall statesSouth AfricaSouth AsiaSouth Asia (IDA & IBRD)South SudanSpainSri LankaSub-Saharan Africa Sub-Saharan Africa (excluding high income)Sub-Saharan Africa (IDA & IBRD countries)SudanSwedenSwitzerlandSyrian Arab RepublicTajikistanTanzaniaThailandTogoTrinidad and TobagoTunisiaTurkeyTurkmenistanUkraineUnited Arab EmiratesUnited KingdomUnited StatesUpper middle incomeUruguayUzbekistanVenezuela, RBVietnamWorldYemen, Rep.ZambiaZimbabwe Linea del tempo:
Questa scala temporale mostra un grafico dal 1961 anno al 2014 anno. World. I dati fino ad 1960 anno non disponibili. Il numero di osservazioni attuali secondo i date: 54.
La fonte (nome):
Indicatori dello sviluppo mondiale
La fonte (organizzazione):
IEA Statistics © OECD/IEA 2014 (http://www.iea.org/stats/index.asp), subject to https://www.iea.org/t&c/termsandconditions/
Categorie:
Environment
sono stati aggiornati
23 apr 2017 anni
Indicatori delle variazioni dei valori per anni
Minima:
1.944
1 gen 2012 anni
Massimo:
3.714
1 gen 1991 anni
Alla data di osservazione
Valore
Variazione assoluta
La variazione rispetto al valore precedente
1 gen 1961 anni
2.613
+2.613
0.0%
1 gen 1962 anni
2.557
-0.056
-2.16%
1 gen 1963 anni
2.676
+0.119
4.64%
1 gen 1964 anni
2.72
+0.045
1.68%
1 gen 1965 anni
2.585
-0.135
-4.97%
1 gen 1966 anni
2.742
+0.157
6.06%
1 gen 1967 anni
2.755
+0.013
0.47%
1 gen 1968 anni
2.66
-0.095
-3.44%
1 gen 1969 anni
2.78
+0.119
4.49%
1 gen 1970 anni
2.745
-0.035
-1.25%
1 gen 1971 anni
2.017
-0.728
-26.51%
1 gen 1972 anni
3.403
+1.386
68.69%
1 gen 1973 anni
3.342
-0.061
-1.8%
1 gen 1974 anni
3.394
+0.052
1.56%
1 gen 1975 anni
3.409
+0.015
0.44%
1 gen 1976 anni
3.637
+0.229
6.7%
1 gen 1977 anni
3.487
-0.15
-4.12%
1 gen 1978 anni
3.431
-0.057
-1.62%
1 gen 1979 anni
3.498
+0.067
1.96%
1 gen 1980 anni
3.688
+0.19
5.44%
1 gen 1981 anni
3.472
-0.216
-5.86%
1 gen 1982 anni
3.575
+0.102
2.95%
1 gen 1983 anni
3.493
-0.082
-2.29%
1 gen 1984 anni
3.625
+0.132
3.77%
1 gen 1985 anni
3.345
-0.28
-7.72%
1 gen 1986 anni
3.312
-0.033
-1.0%
1 gen 1987 anni
3.263
-0.048
-1.45%
1 gen 1988 anni
3.25
-0.014
-0.43%
1 gen 1989 anni
3.152
-0.098
-3.01%
1 gen 1990 anni
2.9
-0.252
-8.0%
1 gen 1991 anni
3.714
+0.814
28.06%
1 gen 1992 anni
3.684
-0.029
-0.79%
1 gen 1993 anni
3.282
-0.402
-10.92%
1 gen 1994 anni
3.331
+0.049
1.5%
1 gen 1995 anni
3.181
-0.149
-4.49%
1 gen 1996 anni
2.869
-0.312
-9.81%
1 gen 1997 anni
2.522
-0.347
-12.09%
1 gen 1998 anni
2.626
+0.103
4.09%
1 gen 1999 anni
2.504
-0.121
-4.63%
1 gen 2000 anni
2.534
+0.03
1.19%
1 gen 2001 anni
2.171
-0.362
-14.3%
1 gen 2002 anni
2.177
+0.005
0.25%
1 gen 2003 anni
2.13
-0.046
-2.13%
1 gen 2004 anni
2.073
-0.058
-2.71%
1 gen 2005 anni
2.143
+0.07
3.37%
1 gen 2006 anni
2.149
+0.006
0.29%
1 gen 2007 anni
2.115
-0.034
-1.58%
1 gen 2008 anni
2.047
-0.068
-3.2%
1 gen 2009 anni
2.002
-0.045
-2.22%
1 gen 2010 anni
2.08
+0.078
3.92%
1 gen 2011 anni
2.004
-0.076
-3.67%
1 gen 2012 anni
1.944
-0.059
-2.97%
1 gen 2013 anni
2.024
+0.08
4.09%
1 gen 2014 anni
2.018
-0.006
-0.28%
Classificazione dei paesi secondo i statistiche attuali per anni


Commenti: