29
/it/
it
AIzaSyAYiBZKx7MnpbEhh9jyipgxe19OcubqV5w
April 1, 2024
137751
Georgia
GEO
true
2
1
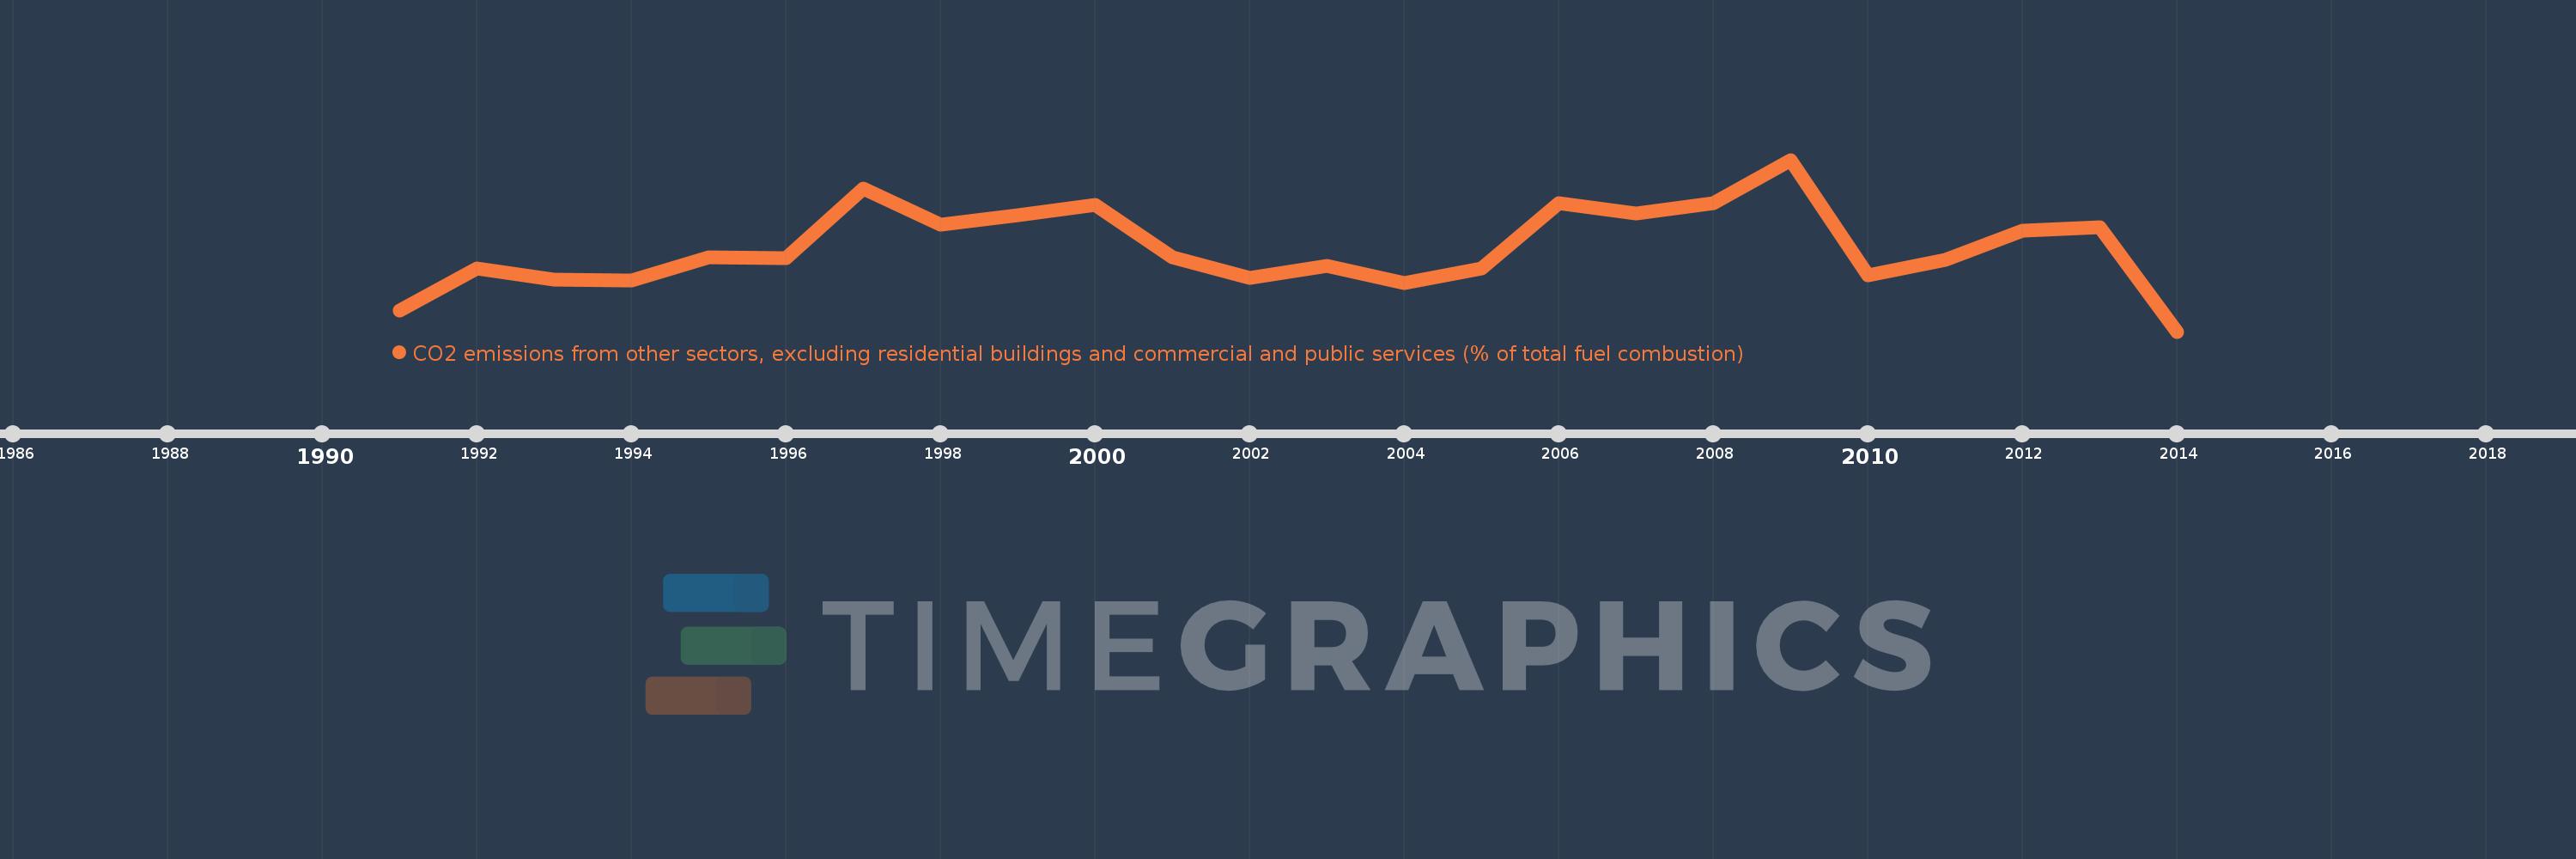
CO2 emissions from other sectors, excluding residential buildings and commercial and public services (% of total fuel combustion)
2014,2013,2012,2011,2010,2009,2008,2007,2006,2005,2004,2003,2002,2001,2000,1999,1998,1997,1996,1995,1994,1993,1992,1991
Queste statistiche in altri paesi:
AlbaniaAlgeriaAngolaArab WorldArgentinaArmeniaAustraliaAustriaAzerbaijanBahrainBangladeshBelarusBelgiumBeninBoliviaBosnia and HerzegovinaBotswanaBrazilBrunei DarussalamBulgariaCambodiaCameroonCanadaCaribbean small statesCentral Europe and the BalticsChileChinaColombiaCongo, Dem. Rep.Congo, Rep.Costa RicaCote d'IvoireCroatiaCubaCuracaoCyprusCzech RepublicDenmarkDominican RepublicEarly-demographic dividendEast Asia & PacificEast Asia & Pacific (excluding high income)East Asia & Pacific (IDA & IBRD countries)EcuadorEgypt, Arab Rep.El SalvadorEritreaEstoniaEthiopiaEuro areaEurope & Central AsiaEurope & Central Asia (excluding high income)Europe & Central Asia (IDA & IBRD countries)European UnionFinlandFragile and conflict affected situationsFranceGabonGeorgiaGermanyGhanaGibraltarGreeceGuatemalaHaitiHeavily indebted poor countries (HIPC)High incomeHondurasHong Kong SAR, ChinaHungaryIBRD onlyIcelandIDA & IBRD totalIDA blendIDA onlyIDA totalIndiaIndonesiaIran, Islamic Rep.IraqIrelandIsraelItalyJamaicaJapanJordanKazakhstanKenyaKorea, Dem. People’s Rep.Korea, Rep.KosovoKuwaitKyrgyz RepublicLate-demographic dividendLatin America & Caribbean Latin America & Caribbean (excluding high income)Latin America & the Caribbean (IDA & IBRD countries)LatviaLeast developed countries: UN classificationLebanonLibyaLithuaniaLow & middle incomeLow incomeLower middle incomeLuxembourgMacedonia, FYRMalaysiaMaltaMauritiusMexicoMiddle East & North AfricaMiddle East & North Africa (excluding high income)Middle East & North Africa (IDA & IBRD countries)Middle incomeMoldovaMongoliaMontenegroMoroccoMozambiqueMyanmarNamibiaNepalNetherlandsNew ZealandNicaraguaNigerNigeriaNorth AmericaNorwayOECD membersOmanOther small statesPakistanPanamaParaguayPeruPhilippinesPolandPortugalPost-demographic dividendPre-demographic dividendQatarRomaniaRussian FederationSaudi ArabiaSenegalSerbiaSingaporeSlovak RepublicSloveniaSmall statesSouth AfricaSouth AsiaSouth Asia (IDA & IBRD)South SudanSpainSri LankaSub-Saharan Africa Sub-Saharan Africa (excluding high income)Sub-Saharan Africa (IDA & IBRD countries)SudanSwedenSwitzerlandSyrian Arab RepublicTajikistanTanzaniaThailandTogoTrinidad and TobagoTunisiaTurkeyTurkmenistanUkraineUnited Arab EmiratesUnited KingdomUnited StatesUpper middle incomeUruguayUzbekistanVenezuela, RBVietnamWorldYemen, Rep.ZambiaZimbabwe Linea del tempo:
Questa scala temporale mostra un grafico dal 1991 anno al 2014 anno. Georgia. I dati fino ad 1990 anno non disponibili. Il numero di osservazioni attuali secondo i date: 24.
La fonte (nome):
Indicatori dello sviluppo mondiale
La fonte (organizzazione):
IEA Statistics © OECD/IEA 2014 (http://www.iea.org/stats/index.asp), subject to https://www.iea.org/t&c/termsandconditions/
Categorie:
Environment
sono stati aggiornati
23 apr 2017 anni
Indicatori delle variazioni dei valori per anni
Minima:
0.452
1 gen 2014 anni
Massimo:
9.422
1 gen 2009 anni
Alla data di osservazione
Valore
Variazione assoluta
La variazione rispetto al valore precedente
1 gen 1991 anni
1.553
+1.553
0.0%
1 gen 1992 anni
3.765
+2.212
142.39%
1 gen 1993 anni
3.172
-0.593
-15.74%
1 gen 1994 anni
3.131
-0.041
-1.3%
1 gen 1995 anni
4.327
+1.196
38.2%
1 gen 1996 anni
4.305
-0.022
-0.51%
1 gen 1997 anni
7.899
+3.594
83.48%
1 gen 1998 anni
6.022
-1.877
-23.76%
1 gen 1999 anni
6.517
+0.495
8.23%
1 gen 2000 anni
7.078
+0.56
8.6%
1 gen 2001 anni
4.32
-2.758
-38.97%
1 gen 2002 anni
3.254
-1.065
-24.66%
1 gen 2003 anni
3.901
+0.646
19.86%
1 gen 2004 anni
2.98
-0.921
-23.6%
1 gen 2005 anni
3.75
+0.77
25.83%
1 gen 2006 anni
7.143
+3.393
90.48%
1 gen 2007 anni
6.637
-0.506
-7.08%
1 gen 2008 anni
7.156
+0.519
7.82%
1 gen 2009 anni
9.422
+2.266
31.66%
1 gen 2010 anni
3.403
-6.019
-63.89%
1 gen 2011 anni
4.208
+0.806
23.68%
1 gen 2012 anni
5.714
+1.506
35.78%
1 gen 2013 anni
5.9
+0.186
3.25%
1 gen 2014 anni
0.452
-5.448
-92.33%
Classificazione dei paesi secondo i statistiche attuali per anni


Commenti: