29
/it/
it
AIzaSyAYiBZKx7MnpbEhh9jyipgxe19OcubqV5w
April 1, 2024
105763
China
CHN
true
2
1
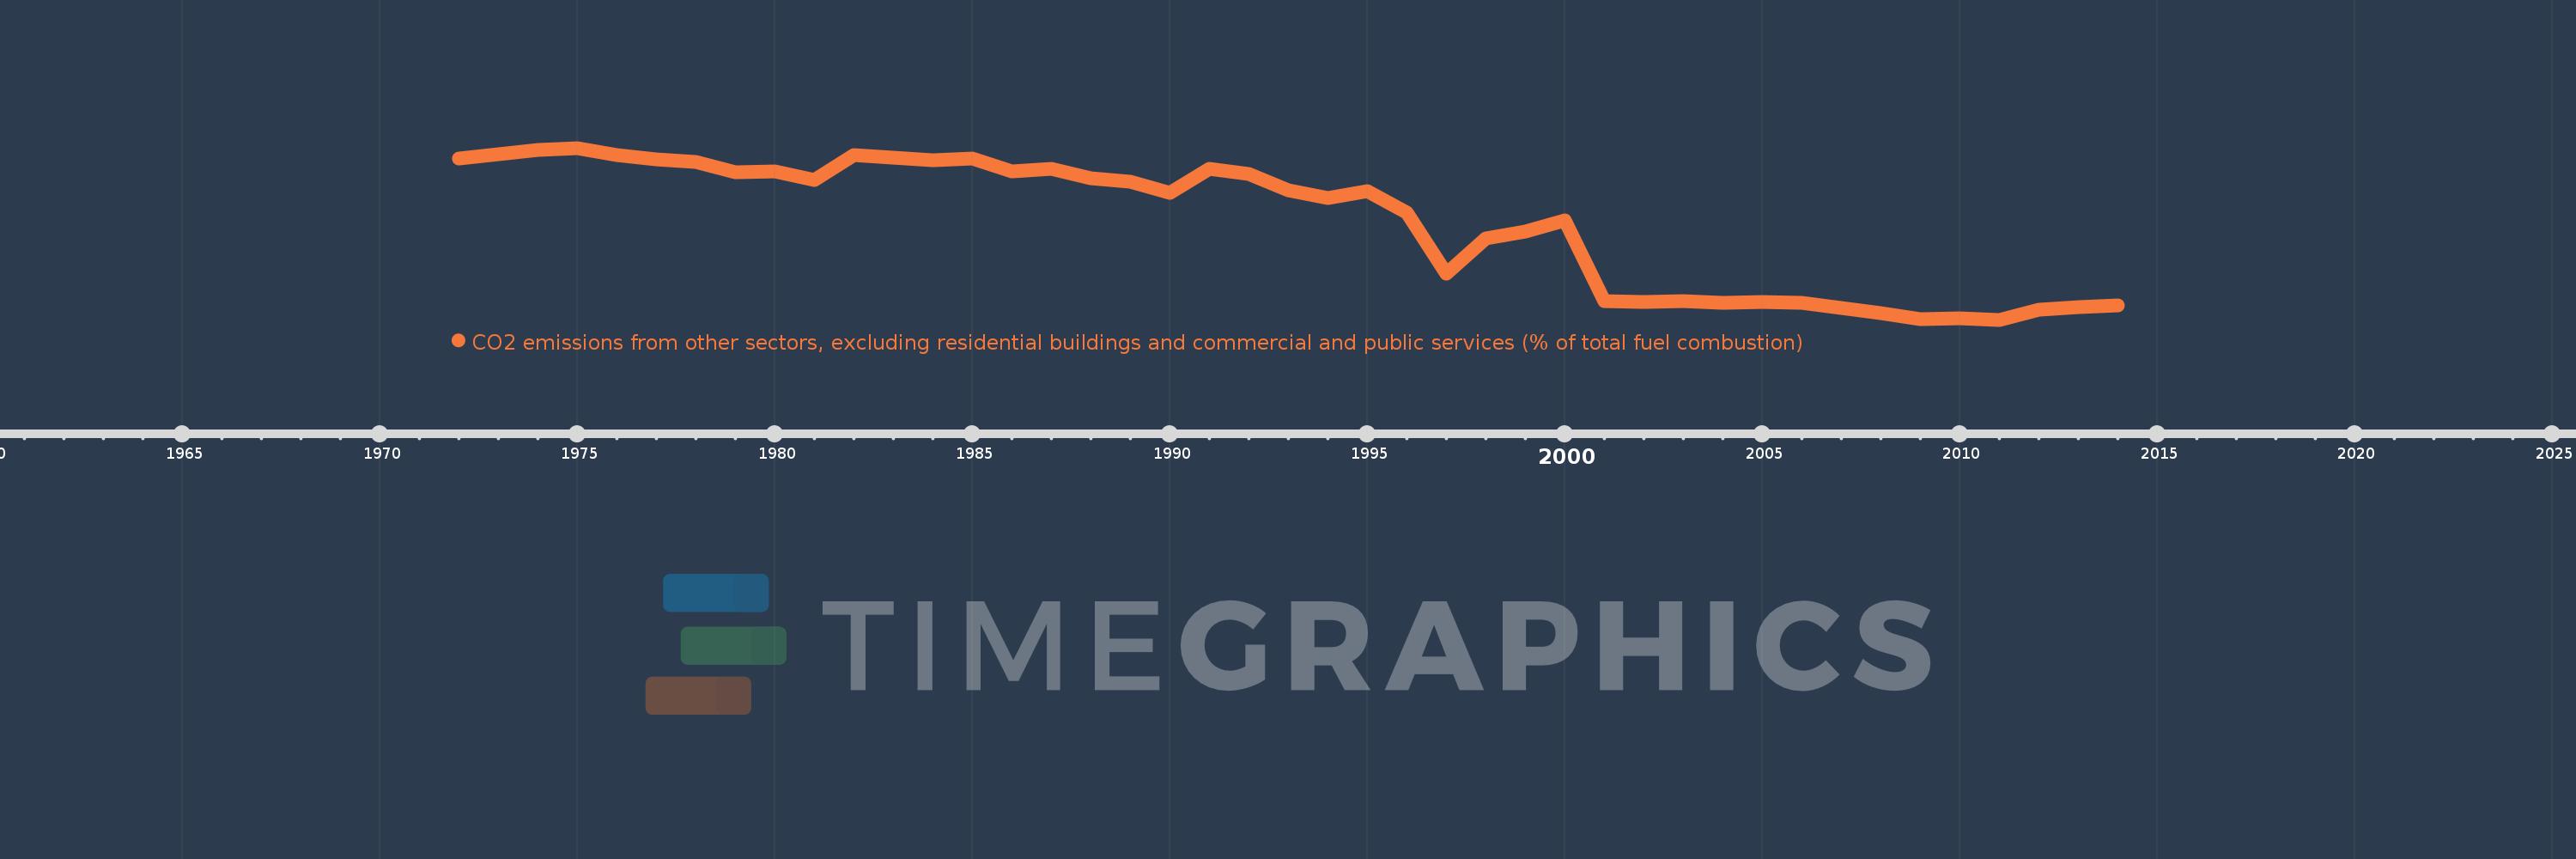
CO2 emissions from other sectors, excluding residential buildings and commercial and public services (% of total fuel combustion)
2014,2013,2012,2011,2010,2009,2008,2007,2006,2005,2004,2003,2002,2001,2000,1999,1998,1997,1996,1995,1994,1993,1992,1991,1990,1989,1988,1987,1986,1985,1984,1983,1982,1981,1980,1979,1978,1977,1976,1975,1974,1973,1972
Queste statistiche in altri paesi:
AlbaniaAlgeriaAngolaArab WorldArgentinaArmeniaAustraliaAustriaAzerbaijanBahrainBangladeshBelarusBelgiumBeninBoliviaBosnia and HerzegovinaBotswanaBrazilBrunei DarussalamBulgariaCambodiaCameroonCanadaCaribbean small statesCentral Europe and the BalticsChileChinaColombiaCongo, Dem. Rep.Congo, Rep.Costa RicaCote d'IvoireCroatiaCubaCuracaoCyprusCzech RepublicDenmarkDominican RepublicEarly-demographic dividendEast Asia & PacificEast Asia & Pacific (excluding high income)East Asia & Pacific (IDA & IBRD countries)EcuadorEgypt, Arab Rep.El SalvadorEritreaEstoniaEthiopiaEuro areaEurope & Central AsiaEurope & Central Asia (excluding high income)Europe & Central Asia (IDA & IBRD countries)European UnionFinlandFragile and conflict affected situationsFranceGabonGeorgiaGermanyGhanaGibraltarGreeceGuatemalaHaitiHeavily indebted poor countries (HIPC)High incomeHondurasHong Kong SAR, ChinaHungaryIBRD onlyIcelandIDA & IBRD totalIDA blendIDA onlyIDA totalIndiaIndonesiaIran, Islamic Rep.IraqIrelandIsraelItalyJamaicaJapanJordanKazakhstanKenyaKorea, Dem. People’s Rep.Korea, Rep.KosovoKuwaitKyrgyz RepublicLate-demographic dividendLatin America & Caribbean Latin America & Caribbean (excluding high income)Latin America & the Caribbean (IDA & IBRD countries)LatviaLeast developed countries: UN classificationLebanonLibyaLithuaniaLow & middle incomeLow incomeLower middle incomeLuxembourgMacedonia, FYRMalaysiaMaltaMauritiusMexicoMiddle East & North AfricaMiddle East & North Africa (excluding high income)Middle East & North Africa (IDA & IBRD countries)Middle incomeMoldovaMongoliaMontenegroMoroccoMozambiqueMyanmarNamibiaNepalNetherlandsNew ZealandNicaraguaNigerNigeriaNorth AmericaNorwayOECD membersOmanOther small statesPakistanPanamaParaguayPeruPhilippinesPolandPortugalPost-demographic dividendPre-demographic dividendQatarRomaniaRussian FederationSaudi ArabiaSenegalSerbiaSingaporeSlovak RepublicSloveniaSmall statesSouth AfricaSouth AsiaSouth Asia (IDA & IBRD)South SudanSpainSri LankaSub-Saharan Africa Sub-Saharan Africa (excluding high income)Sub-Saharan Africa (IDA & IBRD countries)SudanSwedenSwitzerlandSyrian Arab RepublicTajikistanTanzaniaThailandTogoTrinidad and TobagoTunisiaTurkeyTurkmenistanUkraineUnited Arab EmiratesUnited KingdomUnited StatesUpper middle incomeUruguayUzbekistanVenezuela, RBVietnamWorldYemen, Rep.ZambiaZimbabwe Linea del tempo:
Questa scala temporale mostra un grafico dal 1972 anno al 2014 anno. China. I dati fino ad 1971 anno non disponibili. Il numero di osservazioni attuali secondo i date: 43.
La fonte (nome):
Indicatori dello sviluppo mondiale
La fonte (organizzazione):
IEA Statistics © OECD/IEA 2014 (http://www.iea.org/stats/index.asp), subject to https://www.iea.org/t&c/termsandconditions/
Categorie:
Environment
sono stati aggiornati
23 apr 2017 anni
Indicatori delle variazioni dei valori per anni
Minima:
1.69
1 gen 2011 anni
Massimo:
6.36
1 gen 1975 anni
Alla data di osservazione
Valore
Variazione assoluta
La variazione rispetto al valore precedente
1 gen 1972 anni
6.062
+6.062
0.0%
1 gen 1973 anni
6.179
+0.117
1.94%
1 gen 1974 anni
6.304
+0.125
2.03%
1 gen 1975 anni
6.36
+0.056
0.88%
1 gen 1976 anni
6.157
-0.203
-3.19%
1 gen 1977 anni
6.059
-0.098
-1.59%
1 gen 1978 anni
5.975
-0.084
-1.39%
1 gen 1979 anni
5.709
-0.266
-4.45%
1 gen 1980 anni
5.711
+0.002
0.03%
1 gen 1981 anni
5.5
-0.21
-3.68%
1 gen 1982 anni
6.16
+0.659
11.99%
1 gen 1983 anni
6.102
-0.058
-0.94%
1 gen 1984 anni
6.019
-0.083
-1.36%
1 gen 1985 anni
6.072
+0.054
0.89%
1 gen 1986 anni
5.734
-0.338
-5.57%
1 gen 1987 anni
5.794
+0.06
1.04%
1 gen 1988 anni
5.54
-0.254
-4.39%
1 gen 1989 anni
5.453
-0.087
-1.58%
1 gen 1990 anni
5.135
-0.318
-5.82%
1 gen 1991 anni
5.795
+0.66
12.84%
1 gen 1992 anni
5.663
-0.132
-2.28%
1 gen 1993 anni
5.203
-0.46
-8.12%
1 gen 1994 anni
4.991
-0.213
-4.09%
1 gen 1995 anni
5.192
+0.201
4.03%
1 gen 1996 anni
4.598
-0.594
-11.44%
1 gen 1997 anni
2.947
-1.651
-35.9%
1 gen 1998 anni
3.91
+0.963
32.69%
1 gen 1999 anni
4.079
+0.168
4.3%
1 gen 2000 anni
4.397
+0.318
7.8%
1 gen 2001 anni
2.199
-2.198
-50.0%
1 gen 2002 anni
2.174
-0.024
-1.11%
1 gen 2003 anni
2.195
+0.02
0.94%
1 gen 2004 anni
2.157
-0.038
-1.73%
1 gen 2005 anni
2.17
+0.014
0.64%
1 gen 2006 anni
2.139
-0.031
-1.45%
1 gen 2007 anni
2.011
-0.128
-5.99%
1 gen 2008 anni
1.876
-0.135
-6.72%
1 gen 2009 anni
1.71
-0.165
-8.82%
1 gen 2010 anni
1.729
+0.019
1.12%
1 gen 2011 anni
1.69
-0.039
-2.28%
1 gen 2012 anni
1.958
+0.268
15.88%
1 gen 2013 anni
2.04
+0.082
4.18%
1 gen 2014 anni
2.077
+0.037
1.81%
Classificazione dei paesi secondo i statistiche attuali per anni


Commenti: