29
/it/
it
AIzaSyAYiBZKx7MnpbEhh9jyipgxe19OcubqV5w
April 1, 2024
277461
Uruguay
URY
true
2
1
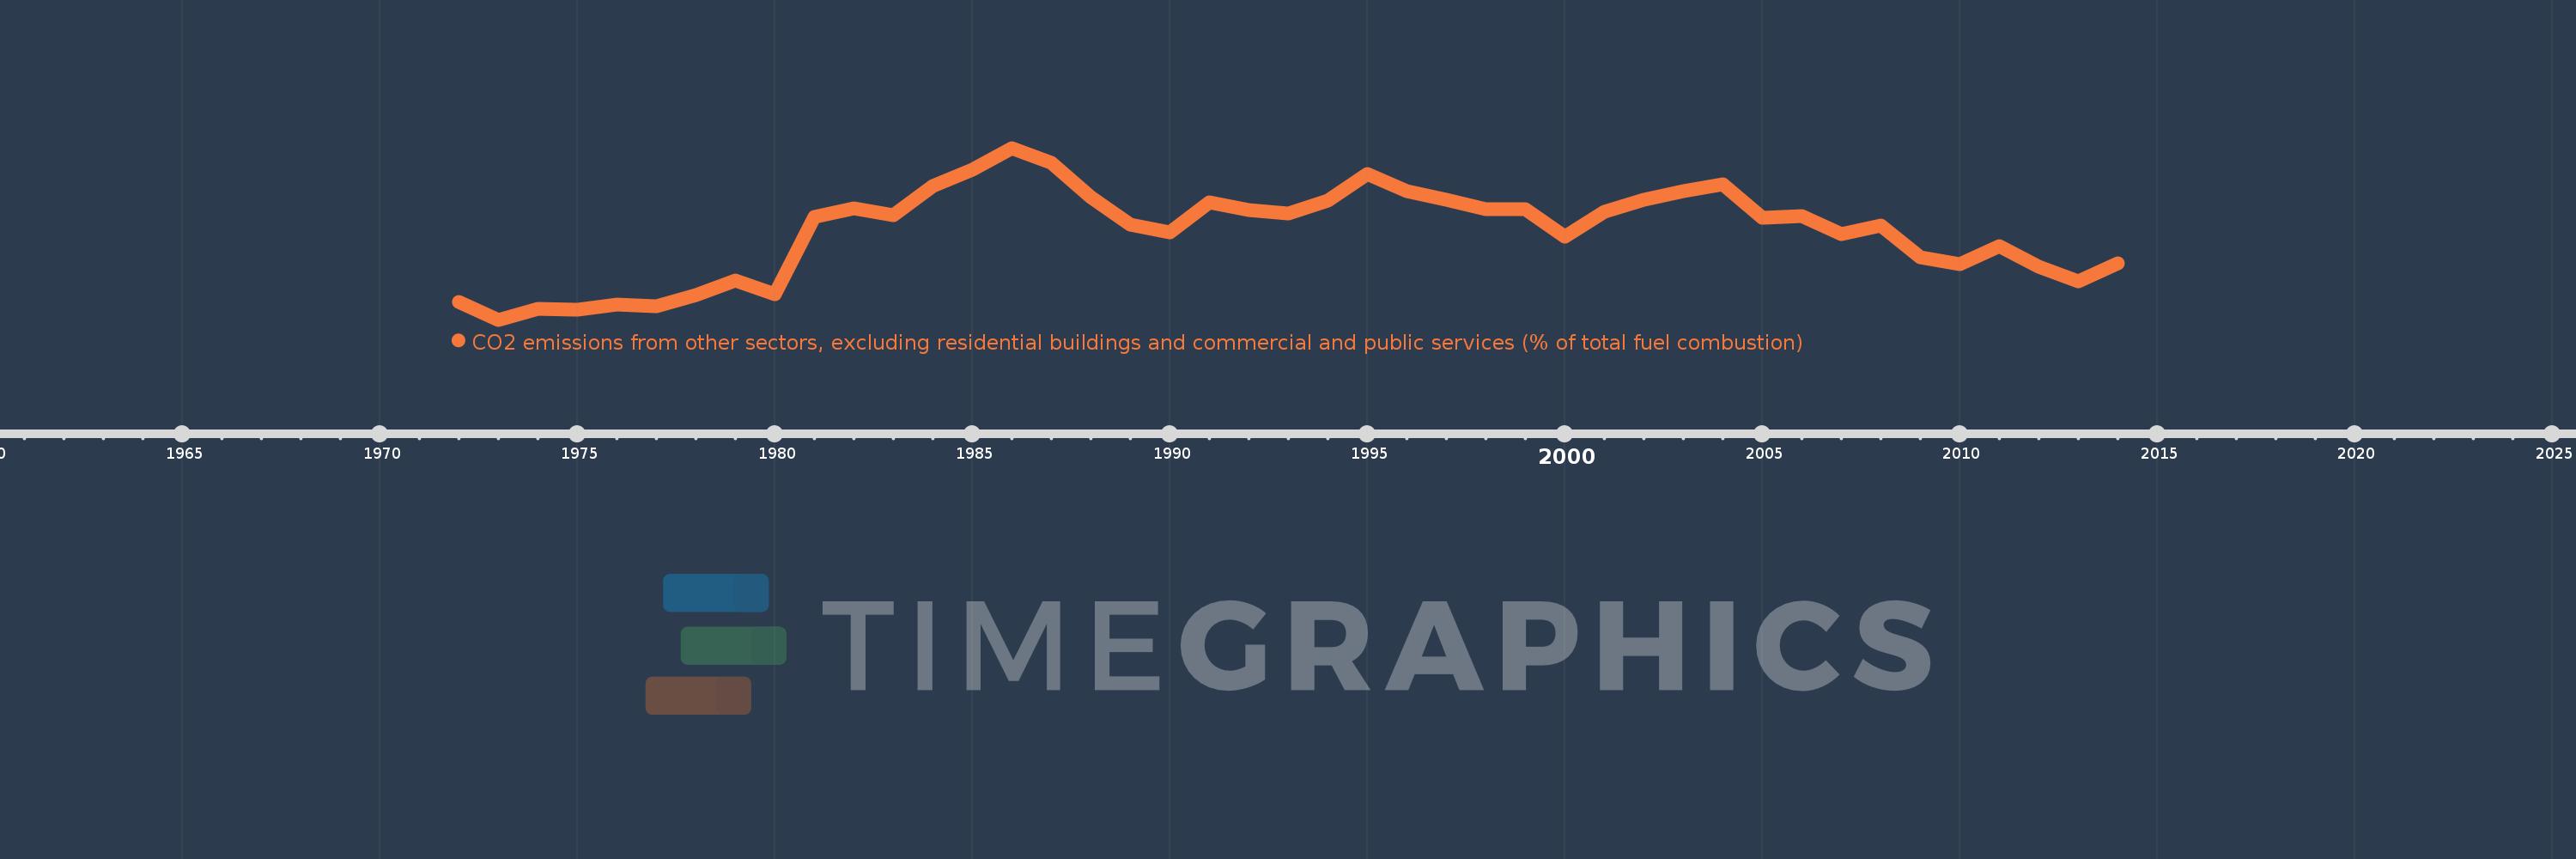
CO2 emissions from other sectors, excluding residential buildings and commercial and public services (% of total fuel combustion)
2014,2013,2012,2011,2010,2009,2008,2007,2006,2005,2004,2003,2002,2001,2000,1999,1998,1997,1996,1995,1994,1993,1992,1991,1990,1989,1988,1987,1986,1985,1984,1983,1982,1981,1980,1979,1978,1977,1976,1975,1974,1973,1972
Queste statistiche in altri paesi:
AlbaniaAlgeriaAngolaArab WorldArgentinaArmeniaAustraliaAustriaAzerbaijanBahrainBangladeshBelarusBelgiumBeninBoliviaBosnia and HerzegovinaBotswanaBrazilBrunei DarussalamBulgariaCambodiaCameroonCanadaCaribbean small statesCentral Europe and the BalticsChileChinaColombiaCongo, Dem. Rep.Congo, Rep.Costa RicaCote d'IvoireCroatiaCubaCuracaoCyprusCzech RepublicDenmarkDominican RepublicEarly-demographic dividendEast Asia & PacificEast Asia & Pacific (excluding high income)East Asia & Pacific (IDA & IBRD countries)EcuadorEgypt, Arab Rep.El SalvadorEritreaEstoniaEthiopiaEuro areaEurope & Central AsiaEurope & Central Asia (excluding high income)Europe & Central Asia (IDA & IBRD countries)European UnionFinlandFragile and conflict affected situationsFranceGabonGeorgiaGermanyGhanaGibraltarGreeceGuatemalaHaitiHeavily indebted poor countries (HIPC)High incomeHondurasHong Kong SAR, ChinaHungaryIBRD onlyIcelandIDA & IBRD totalIDA blendIDA onlyIDA totalIndiaIndonesiaIran, Islamic Rep.IraqIrelandIsraelItalyJamaicaJapanJordanKazakhstanKenyaKorea, Dem. People’s Rep.Korea, Rep.KosovoKuwaitKyrgyz RepublicLate-demographic dividendLatin America & Caribbean Latin America & Caribbean (excluding high income)Latin America & the Caribbean (IDA & IBRD countries)LatviaLeast developed countries: UN classificationLebanonLibyaLithuaniaLow & middle incomeLow incomeLower middle incomeLuxembourgMacedonia, FYRMalaysiaMaltaMauritiusMexicoMiddle East & North AfricaMiddle East & North Africa (excluding high income)Middle East & North Africa (IDA & IBRD countries)Middle incomeMoldovaMongoliaMontenegroMoroccoMozambiqueMyanmarNamibiaNepalNetherlandsNew ZealandNicaraguaNigerNigeriaNorth AmericaNorwayOECD membersOmanOther small statesPakistanPanamaParaguayPeruPhilippinesPolandPortugalPost-demographic dividendPre-demographic dividendQatarRomaniaRussian FederationSaudi ArabiaSenegalSerbiaSingaporeSlovak RepublicSloveniaSmall statesSouth AfricaSouth AsiaSouth Asia (IDA & IBRD)South SudanSpainSri LankaSub-Saharan Africa Sub-Saharan Africa (excluding high income)Sub-Saharan Africa (IDA & IBRD countries)SudanSwedenSwitzerlandSyrian Arab RepublicTajikistanTanzaniaThailandTogoTrinidad and TobagoTunisiaTurkeyTurkmenistanUkraineUnited Arab EmiratesUnited KingdomUnited StatesUpper middle incomeUruguayUzbekistanVenezuela, RBVietnamWorldYemen, Rep.ZambiaZimbabwe Linea del tempo:
Questa scala temporale mostra un grafico dal 1972 anno al 2014 anno. Uruguay. I dati fino ad 1971 anno non disponibili. Il numero di osservazioni attuali secondo i date: 43.
La fonte (nome):
Indicatori dello sviluppo mondiale
La fonte (organizzazione):
IEA Statistics © OECD/IEA 2014 (http://www.iea.org/stats/index.asp), subject to https://www.iea.org/t&c/termsandconditions/
Categorie:
Environment
sono stati aggiornati
23 apr 2017 anni
Indicatori delle variazioni dei valori per anni
Minima:
3.232
1 gen 1973 anni
Massimo:
15.615
1 gen 1986 anni
Alla data di osservazione
Valore
Variazione assoluta
La variazione rispetto al valore precedente
1 gen 1972 anni
4.51
+4.51
0.0%
1 gen 1973 anni
3.232
-1.278
-28.34%
1 gen 1974 anni
4.023
+0.791
24.49%
1 gen 1975 anni
3.976
-0.047
-1.16%
1 gen 1976 anni
4.315
+0.339
8.53%
1 gen 1977 anni
4.212
-0.103
-2.38%
1 gen 1978 anni
5.019
+0.806
19.14%
1 gen 1979 anni
6.044
+1.025
20.43%
1 gen 1980 anni
5.042
-1.002
-16.58%
1 gen 1981 anni
10.674
+5.632
111.7%
1 gen 1982 anni
11.273
+0.599
5.61%
1 gen 1983 anni
10.762
-0.511
-4.53%
1 gen 1984 anni
12.849
+2.087
19.39%
1 gen 1985 anni
14.019
+1.17
9.1%
1 gen 1986 anni
15.615
+1.596
11.38%
1 gen 1987 anni
14.527
-1.088
-6.97%
1 gen 1988 anni
12.048
-2.479
-17.06%
1 gen 1989 anni
10.07
-1.978
-16.42%
1 gen 1990 anni
9.524
-0.546
-5.43%
1 gen 1991 anni
11.667
+2.143
22.5%
1 gen 1992 anni
11.138
-0.529
-4.53%
1 gen 1993 anni
10.865
-0.273
-2.45%
1 gen 1994 anni
11.792
+0.928
8.54%
1 gen 1995 anni
13.74
+1.948
16.52%
1 gen 1996 anni
12.528
-1.212
-8.82%
1 gen 1997 anni
11.891
-0.638
-5.09%
1 gen 1998 anni
11.175
-0.716
-6.02%
1 gen 1999 anni
11.215
+0.04
0.35%
1 gen 2000 anni
9.219
-1.996
-17.8%
1 gen 2001 anni
11.002
+1.783
19.34%
1 gen 2002 anni
11.894
+0.892
8.11%
1 gen 2003 anni
12.53
+0.636
5.35%
1 gen 2004 anni
13.022
+0.492
3.93%
1 gen 2005 anni
10.577
-2.445
-18.78%
1 gen 2006 anni
10.68
+0.103
0.97%
1 gen 2007 anni
9.375
-1.305
-12.22%
1 gen 2008 anni
10.054
+0.679
7.24%
1 gen 2009 anni
7.764
-2.289
-22.77%
1 gen 2010 anni
7.248
-0.516
-6.65%
1 gen 2011 anni
8.557
+1.309
18.06%
1 gen 2012 anni
7.064
-1.493
-17.45%
1 gen 2013 anni
5.983
-1.081
-15.3%
1 gen 2014 anni
7.314
+1.331
22.24%
Classificazione dei paesi secondo i statistiche attuali per anni


Commenti: