29
/it/
it
AIzaSyAYiBZKx7MnpbEhh9jyipgxe19OcubqV5w
April 1, 2024
257117
Switzerland
CHE
true
2
1
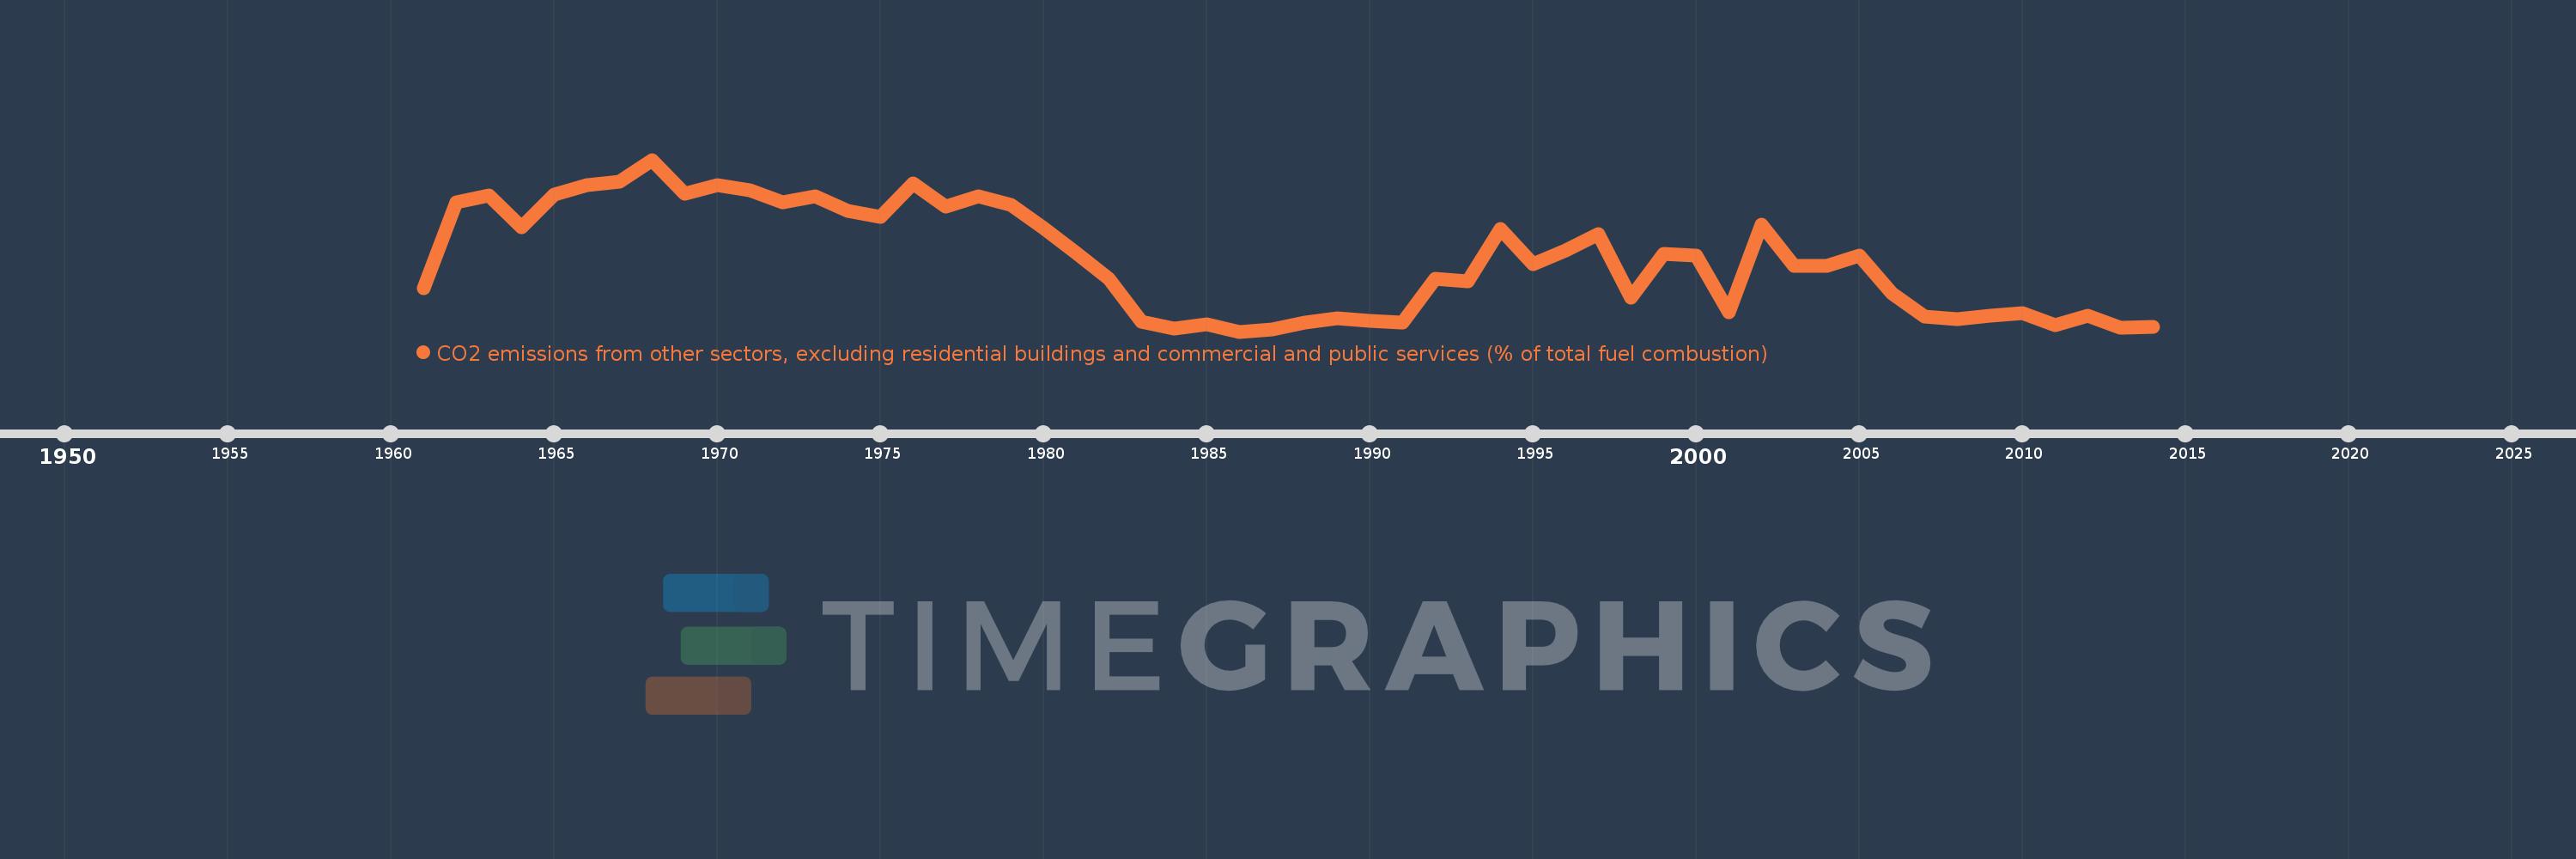
CO2 emissions from other sectors, excluding residential buildings and commercial and public services (% of total fuel combustion)
2014,2013,2012,2011,2010,2009,2008,2007,2006,2005,2004,2003,2002,2001,2000,1999,1998,1997,1996,1995,1994,1993,1992,1991,1990,1989,1988,1987,1986,1985,1984,1983,1982,1981,1980,1979,1978,1977,1976,1975,1974,1973,1972,1971,1970,1969,1968,1967,1966,1965,1964,1963,1962,1961
Queste statistiche in altri paesi:
AlbaniaAlgeriaAngolaArab WorldArgentinaArmeniaAustraliaAustriaAzerbaijanBahrainBangladeshBelarusBelgiumBeninBoliviaBosnia and HerzegovinaBotswanaBrazilBrunei DarussalamBulgariaCambodiaCameroonCanadaCaribbean small statesCentral Europe and the BalticsChileChinaColombiaCongo, Dem. Rep.Congo, Rep.Costa RicaCote d'IvoireCroatiaCubaCuracaoCyprusCzech RepublicDenmarkDominican RepublicEarly-demographic dividendEast Asia & PacificEast Asia & Pacific (excluding high income)East Asia & Pacific (IDA & IBRD countries)EcuadorEgypt, Arab Rep.El SalvadorEritreaEstoniaEthiopiaEuro areaEurope & Central AsiaEurope & Central Asia (excluding high income)Europe & Central Asia (IDA & IBRD countries)European UnionFinlandFragile and conflict affected situationsFranceGabonGeorgiaGermanyGhanaGibraltarGreeceGuatemalaHaitiHeavily indebted poor countries (HIPC)High incomeHondurasHong Kong SAR, ChinaHungaryIBRD onlyIcelandIDA & IBRD totalIDA blendIDA onlyIDA totalIndiaIndonesiaIran, Islamic Rep.IraqIrelandIsraelItalyJamaicaJapanJordanKazakhstanKenyaKorea, Dem. People’s Rep.Korea, Rep.KosovoKuwaitKyrgyz RepublicLate-demographic dividendLatin America & Caribbean Latin America & Caribbean (excluding high income)Latin America & the Caribbean (IDA & IBRD countries)LatviaLeast developed countries: UN classificationLebanonLibyaLithuaniaLow & middle incomeLow incomeLower middle incomeLuxembourgMacedonia, FYRMalaysiaMaltaMauritiusMexicoMiddle East & North AfricaMiddle East & North Africa (excluding high income)Middle East & North Africa (IDA & IBRD countries)Middle incomeMoldovaMongoliaMontenegroMoroccoMozambiqueMyanmarNamibiaNepalNetherlandsNew ZealandNicaraguaNigerNigeriaNorth AmericaNorwayOECD membersOmanOther small statesPakistanPanamaParaguayPeruPhilippinesPolandPortugalPost-demographic dividendPre-demographic dividendQatarRomaniaRussian FederationSaudi ArabiaSenegalSerbiaSingaporeSlovak RepublicSloveniaSmall statesSouth AfricaSouth AsiaSouth Asia (IDA & IBRD)South SudanSpainSri LankaSub-Saharan Africa Sub-Saharan Africa (excluding high income)Sub-Saharan Africa (IDA & IBRD countries)SudanSwedenSwitzerlandSyrian Arab RepublicTajikistanTanzaniaThailandTogoTrinidad and TobagoTunisiaTurkeyTurkmenistanUkraineUnited Arab EmiratesUnited KingdomUnited StatesUpper middle incomeUruguayUzbekistanVenezuela, RBVietnamWorldYemen, Rep.ZambiaZimbabwe Linea del tempo:
Questa scala temporale mostra un grafico dal 1961 anno al 2014 anno. Switzerland. I dati fino ad 1960 anno non disponibili. Il numero di osservazioni attuali secondo i date: 54.
La fonte (nome):
Indicatori dello sviluppo mondiale
La fonte (organizzazione):
IEA Statistics © OECD/IEA 2014 (http://www.iea.org/stats/index.asp), subject to https://www.iea.org/t&c/termsandconditions/
Categorie:
Environment
sono stati aggiornati
23 apr 2017 anni
Indicatori delle variazioni dei valori per anni
Minima:
1.317
1 gen 1986 anni
Massimo:
3.387
1 gen 1968 anni
Alla data di osservazione
Valore
Variazione assoluta
La variazione rispetto al valore precedente
1 gen 1961 anni
1.842
+1.842
0.0%
1 gen 1962 anni
2.873
+1.031
55.99%
1 gen 1963 anni
2.954
+0.081
2.83%
1 gen 1964 anni
2.579
-0.375
-12.7%
1 gen 1965 anni
2.968
+0.389
15.1%
1 gen 1966 anni
3.086
+0.118
3.98%
1 gen 1967 anni
3.122
+0.036
1.15%
1 gen 1968 anni
3.387
+0.266
8.52%
1 gen 1969 anni
2.975
-0.413
-12.18%
1 gen 1970 anni
3.079
+0.104
3.51%
1 gen 1971 anni
3.021
-0.058
-1.88%
1 gen 1972 anni
2.878
-0.143
-4.73%
1 gen 1973 anni
2.946
+0.068
2.36%
1 gen 1974 anni
2.769
-0.177
-6.01%
1 gen 1975 anni
2.702
-0.067
-2.43%
1 gen 1976 anni
3.103
+0.401
14.84%
1 gen 1977 anni
2.826
-0.277
-8.92%
1 gen 1978 anni
2.95
+0.124
4.39%
1 gen 1979 anni
2.843
-0.107
-3.64%
1 gen 1980 anni
2.562
-0.281
-9.88%
1 gen 1981 anni
2.268
-0.295
-11.5%
1 gen 1982 anni
1.95
-0.317
-14.0%
1 gen 1983 anni
1.431
-0.519
-26.6%
1 gen 1984 anni
1.357
-0.075
-5.21%
1 gen 1985 anni
1.401
+0.044
3.26%
1 gen 1986 anni
1.317
-0.084
-6.0%
1 gen 1987 anni
1.344
+0.027
2.06%
1 gen 1988 anni
1.425
+0.08
5.98%
1 gen 1989 anni
1.48
+0.056
3.9%
1 gen 1990 anni
1.445
-0.036
-2.41%
1 gen 1991 anni
1.424
-0.02
-1.42%
1 gen 1992 anni
1.958
+0.534
37.47%
1 gen 1993 anni
1.927
-0.031
-1.56%
1 gen 1994 anni
2.552
+0.625
32.42%
1 gen 1995 anni
2.125
-0.427
-16.74%
1 gen 1996 anni
2.292
+0.168
7.91%
1 gen 1997 anni
2.488
+0.196
8.54%
1 gen 1998 anni
1.727
-0.761
-30.6%
1 gen 1999 anni
2.253
+0.526
30.48%
1 gen 2000 anni
2.238
-0.015
-0.65%
1 gen 2001 anni
1.551
-0.687
-30.69%
1 gen 2002 anni
2.608
+1.057
68.11%
1 gen 2003 anni
2.106
-0.502
-19.25%
1 gen 2004 anni
2.109
+0.004
0.17%
1 gen 2005 anni
2.234
+0.125
5.91%
1 gen 2006 anni
1.778
-0.456
-20.39%
1 gen 2007 anni
1.497
-0.281
-15.82%
1 gen 2008 anni
1.471
-0.026
-1.76%
1 gen 2009 anni
1.513
+0.043
2.91%
1 gen 2010 anni
1.537
+0.023
1.53%
1 gen 2011 anni
1.394
-0.143
-9.3%
1 gen 2012 anni
1.511
+0.117
8.41%
1 gen 2013 anni
1.359
-0.152
-10.05%
1 gen 2014 anni
1.372
+0.013
0.97%
Classificazione dei paesi secondo i statistiche attuali per anni


Commenti: