29
/it/
it
AIzaSyAYiBZKx7MnpbEhh9jyipgxe19OcubqV5w
April 1, 2024
51721
North America
NAC
false
2
1
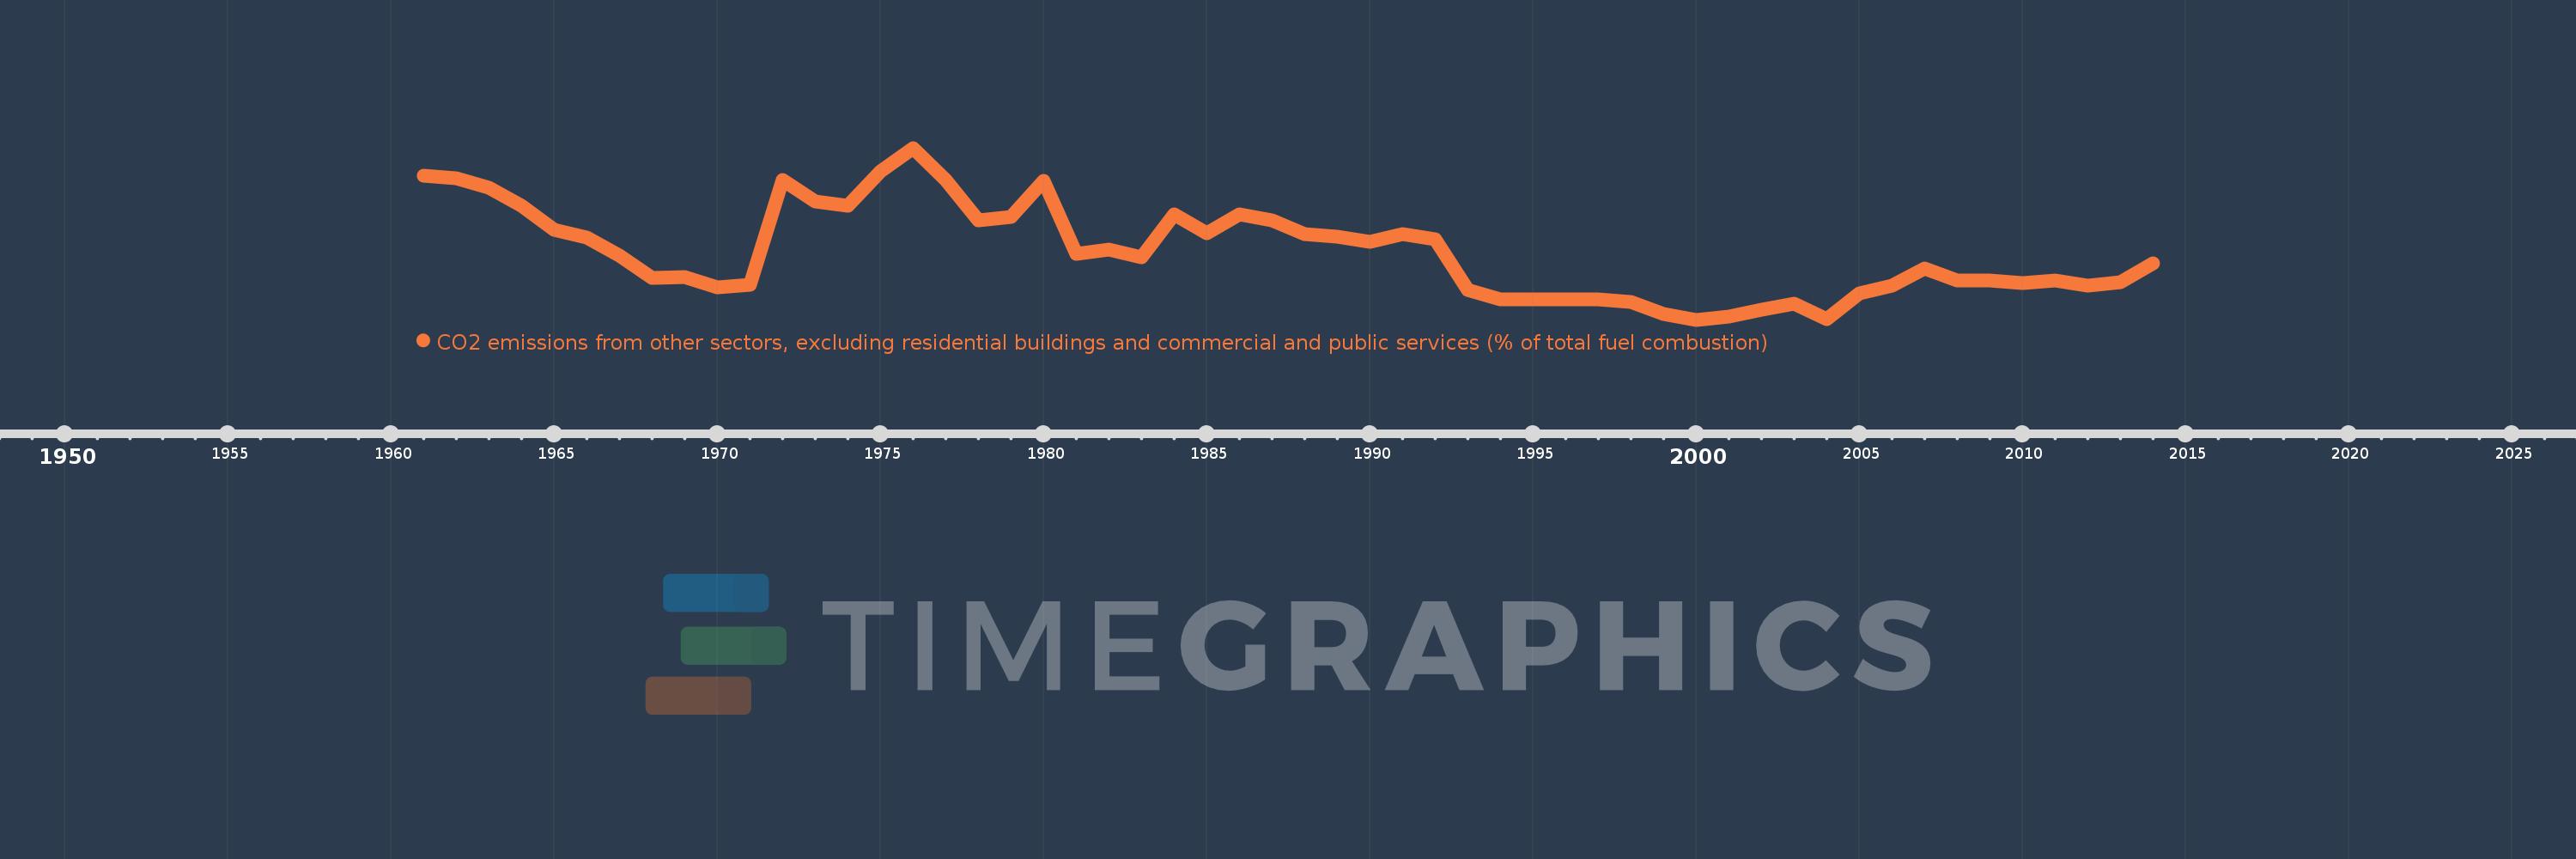
CO2 emissions from other sectors, excluding residential buildings and commercial and public services (% of total fuel combustion)
2014,2013,2012,2011,2010,2009,2008,2007,2006,2005,2004,2003,2002,2001,2000,1999,1998,1997,1996,1995,1994,1993,1992,1991,1990,1989,1988,1987,1986,1985,1984,1983,1982,1981,1980,1979,1978,1977,1976,1975,1974,1973,1972,1971,1970,1969,1968,1967,1966,1965,1964,1963,1962,1961
Queste statistiche in altri paesi:
AlbaniaAlgeriaAngolaArab WorldArgentinaArmeniaAustraliaAustriaAzerbaijanBahrainBangladeshBelarusBelgiumBeninBoliviaBosnia and HerzegovinaBotswanaBrazilBrunei DarussalamBulgariaCambodiaCameroonCanadaCaribbean small statesCentral Europe and the BalticsChileChinaColombiaCongo, Dem. Rep.Congo, Rep.Costa RicaCote d'IvoireCroatiaCubaCuracaoCyprusCzech RepublicDenmarkDominican RepublicEarly-demographic dividendEast Asia & PacificEast Asia & Pacific (excluding high income)East Asia & Pacific (IDA & IBRD countries)EcuadorEgypt, Arab Rep.El SalvadorEritreaEstoniaEthiopiaEuro areaEurope & Central AsiaEurope & Central Asia (excluding high income)Europe & Central Asia (IDA & IBRD countries)European UnionFinlandFragile and conflict affected situationsFranceGabonGeorgiaGermanyGhanaGibraltarGreeceGuatemalaHaitiHeavily indebted poor countries (HIPC)High incomeHondurasHong Kong SAR, ChinaHungaryIBRD onlyIcelandIDA & IBRD totalIDA blendIDA onlyIDA totalIndiaIndonesiaIran, Islamic Rep.IraqIrelandIsraelItalyJamaicaJapanJordanKazakhstanKenyaKorea, Dem. People’s Rep.Korea, Rep.KosovoKuwaitKyrgyz RepublicLate-demographic dividendLatin America & Caribbean Latin America & Caribbean (excluding high income)Latin America & the Caribbean (IDA & IBRD countries)LatviaLeast developed countries: UN classificationLebanonLibyaLithuaniaLow & middle incomeLow incomeLower middle incomeLuxembourgMacedonia, FYRMalaysiaMaltaMauritiusMexicoMiddle East & North AfricaMiddle East & North Africa (excluding high income)Middle East & North Africa (IDA & IBRD countries)Middle incomeMoldovaMongoliaMontenegroMoroccoMozambiqueMyanmarNamibiaNepalNetherlandsNew ZealandNicaraguaNigerNigeriaNorth AmericaNorwayOECD membersOmanOther small statesPakistanPanamaParaguayPeruPhilippinesPolandPortugalPost-demographic dividendPre-demographic dividendQatarRomaniaRussian FederationSaudi ArabiaSenegalSerbiaSingaporeSlovak RepublicSloveniaSmall statesSouth AfricaSouth AsiaSouth Asia (IDA & IBRD)South SudanSpainSri LankaSub-Saharan Africa Sub-Saharan Africa (excluding high income)Sub-Saharan Africa (IDA & IBRD countries)SudanSwedenSwitzerlandSyrian Arab RepublicTajikistanTanzaniaThailandTogoTrinidad and TobagoTunisiaTurkeyTurkmenistanUkraineUnited Arab EmiratesUnited KingdomUnited StatesUpper middle incomeUruguayUzbekistanVenezuela, RBVietnamWorldYemen, Rep.ZambiaZimbabwe Linea del tempo:
Questa scala temporale mostra un grafico dal 1961 anno al 2014 anno. North America. I dati fino ad 1960 anno non disponibili. Il numero di osservazioni attuali secondo i date: 54.
La fonte (nome):
Indicatori dello sviluppo mondiale
La fonte (organizzazione):
IEA Statistics © OECD/IEA 2014 (http://www.iea.org/stats/index.asp), subject to https://www.iea.org/t&c/termsandconditions/
Categorie:
Environment
sono stati aggiornati
23 apr 2017 anni
Indicatori delle variazioni dei valori per anni
Minima:
0.861
1 gen 2000 anni
Massimo:
1.968
1 gen 1976 anni
Alla data di osservazione
Valore
Variazione assoluta
La variazione rispetto al valore precedente
1 gen 1961 anni
1.79
+1.79
0.0%
1 gen 1962 anni
1.772
-0.017
-0.98%
1 gen 1963 anni
1.711
-0.061
-3.45%
1 gen 1964 anni
1.593
-0.118
-6.89%
1 gen 1965 anni
1.441
-0.153
-9.58%
1 gen 1966 anni
1.389
-0.052
-3.59%
1 gen 1967 anni
1.275
-0.114
-8.2%
1 gen 1968 anni
1.131
-0.144
-11.27%
1 gen 1969 anni
1.135
+0.004
0.32%
1 gen 1970 anni
1.07
-0.065
-5.7%
1 gen 1971 anni
1.086
+0.016
1.48%
1 gen 1972 anni
1.76
+0.674
62.03%
1 gen 1973 anni
1.625
-0.134
-7.64%
1 gen 1974 anni
1.593
-0.033
-2.0%
1 gen 1975 anni
1.819
+0.226
14.22%
1 gen 1976 anni
1.968
+0.149
8.17%
1 gen 1977 anni
1.759
-0.209
-10.62%
1 gen 1978 anni
1.502
-0.257
-14.63%
1 gen 1979 anni
1.526
+0.024
1.62%
1 gen 1980 anni
1.755
+0.229
15.03%
1 gen 1981 anni
1.288
-0.467
-26.63%
1 gen 1982 anni
1.311
+0.023
1.79%
1 gen 1983 anni
1.264
-0.047
-3.56%
1 gen 1984 anni
1.541
+0.276
21.87%
1 gen 1985 anni
1.416
-0.125
-8.09%
1 gen 1986 anni
1.542
+0.126
8.88%
1 gen 1987 anni
1.504
-0.038
-2.49%
1 gen 1988 anni
1.413
-0.091
-6.02%
1 gen 1989 anni
1.397
-0.016
-1.15%
1 gen 1990 anni
1.363
-0.034
-2.41%
1 gen 1991 anni
1.411
+0.048
3.5%
1 gen 1992 anni
1.38
-0.031
-2.21%
1 gen 1993 anni
1.052
-0.328
-23.77%
1 gen 1994 anni
0.992
-0.06
-5.67%
1 gen 1995 anni
0.992
+0.0
0.0%
1 gen 1996 anni
0.991
-0.001
-0.11%
1 gen 1997 anni
0.991
+0.0
0.0%
1 gen 1998 anni
0.975
-0.016
-1.61%
1 gen 1999 anni
0.899
-0.076
-7.77%
1 gen 2000 anni
0.861
-0.039
-4.29%
1 gen 2001 anni
0.882
+0.021
2.45%
1 gen 2002 anni
0.923
+0.041
4.65%
1 gen 2003 anni
0.962
+0.039
4.22%
1 gen 2004 anni
0.865
-0.097
-10.06%
1 gen 2005 anni
1.031
+0.166
19.21%
1 gen 2006 anni
1.083
+0.052
5.06%
1 gen 2007 anni
1.191
+0.108
9.97%
1 gen 2008 anni
1.113
-0.078
-6.52%
1 gen 2009 anni
1.115
+0.002
0.18%
1 gen 2010 anni
1.097
-0.019
-1.66%
1 gen 2011 anni
1.113
+0.016
1.44%
1 gen 2012 anni
1.082
-0.03
-2.71%
1 gen 2013 anni
1.101
+0.018
1.69%
1 gen 2014 anni
1.222
+0.121
11.01%
Classificazione dei paesi secondo i statistiche attuali per anni


Commenti: