29
/it/
it
AIzaSyAYiBZKx7MnpbEhh9jyipgxe19OcubqV5w
April 1, 2024
228233
Romania
ROU
true
2
1
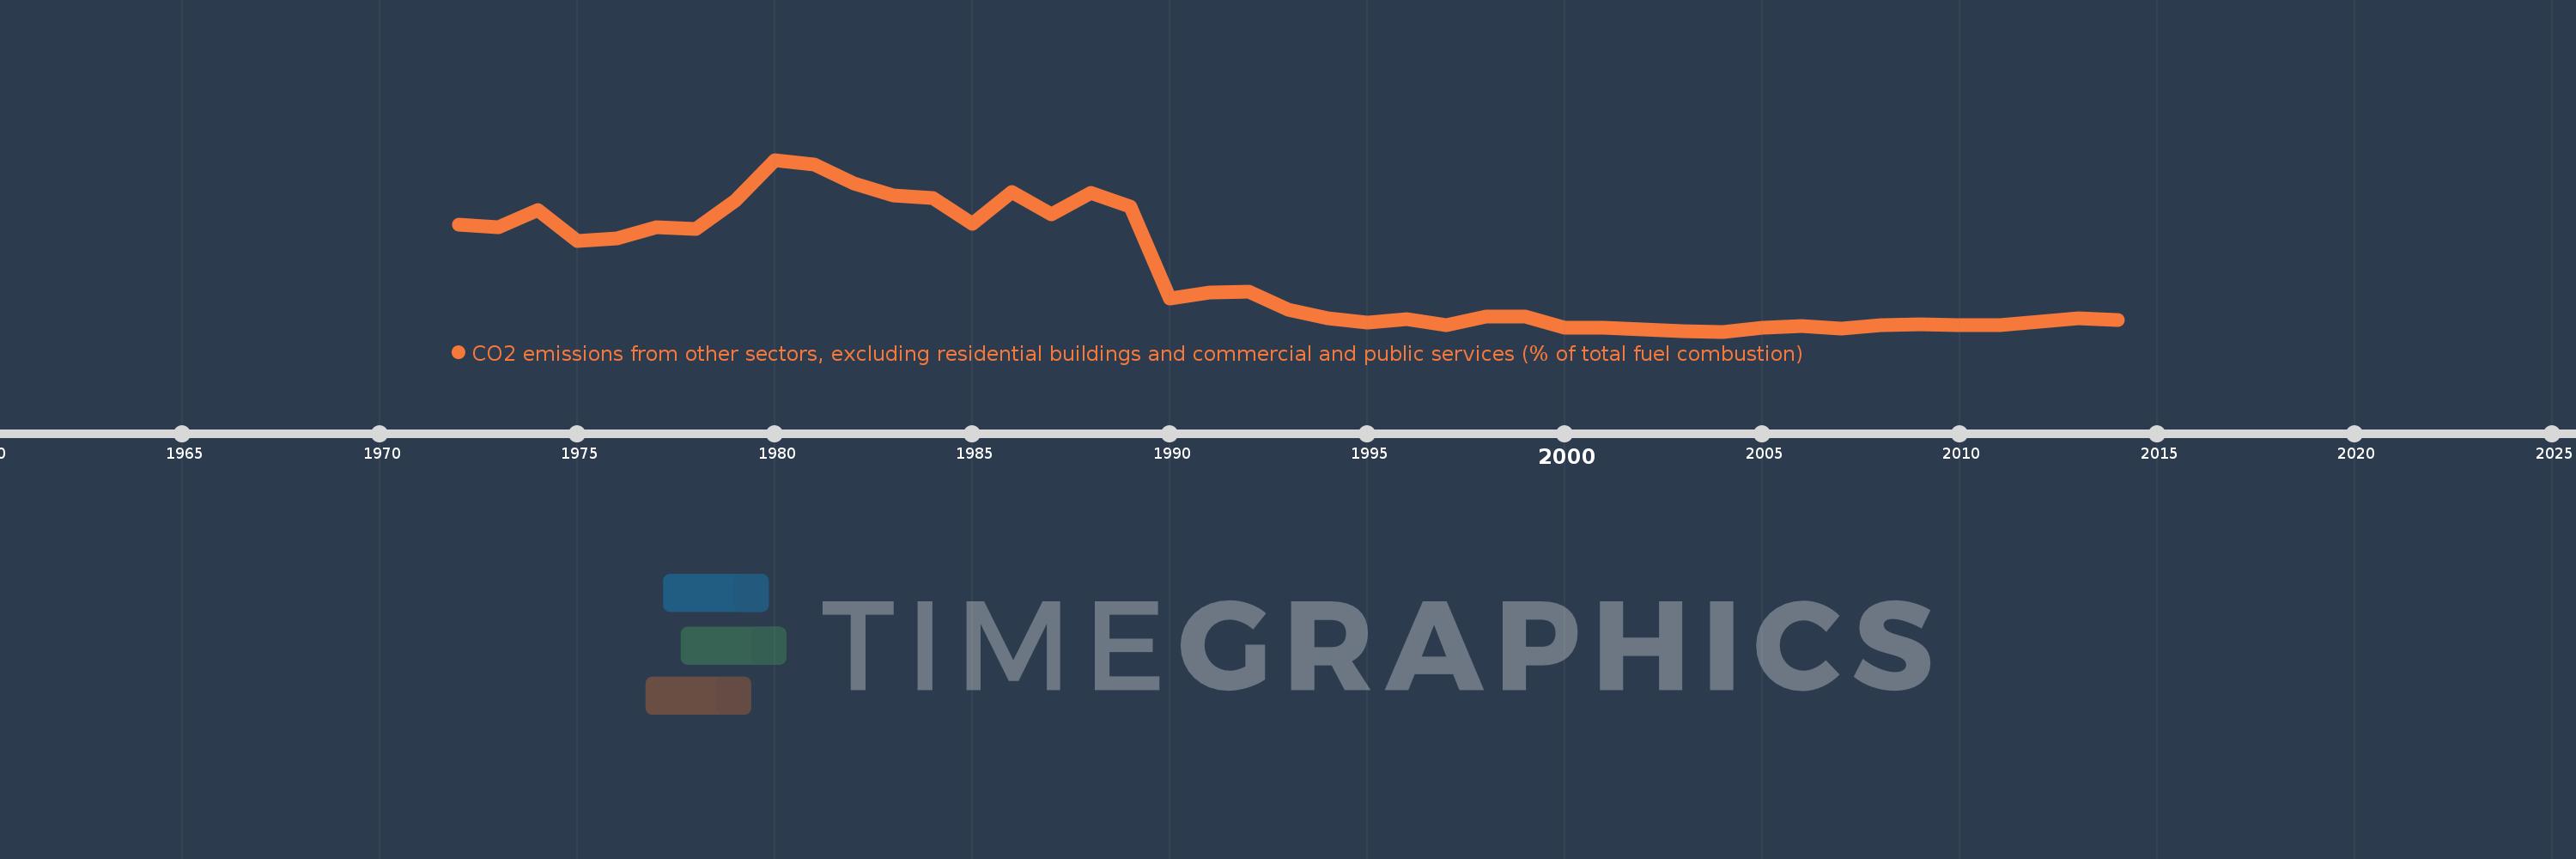
CO2 emissions from other sectors, excluding residential buildings and commercial and public services (% of total fuel combustion)
2014,2013,2012,2011,2010,2009,2008,2007,2006,2005,2004,2003,2002,2001,2000,1999,1998,1997,1996,1995,1994,1993,1992,1991,1990,1989,1988,1987,1986,1985,1984,1983,1982,1981,1980,1979,1978,1977,1976,1975,1974,1973,1972
Queste statistiche in altri paesi:
AlbaniaAlgeriaAngolaArab WorldArgentinaArmeniaAustraliaAustriaAzerbaijanBahrainBangladeshBelarusBelgiumBeninBoliviaBosnia and HerzegovinaBotswanaBrazilBrunei DarussalamBulgariaCambodiaCameroonCanadaCaribbean small statesCentral Europe and the BalticsChileChinaColombiaCongo, Dem. Rep.Congo, Rep.Costa RicaCote d'IvoireCroatiaCubaCuracaoCyprusCzech RepublicDenmarkDominican RepublicEarly-demographic dividendEast Asia & PacificEast Asia & Pacific (excluding high income)East Asia & Pacific (IDA & IBRD countries)EcuadorEgypt, Arab Rep.El SalvadorEritreaEstoniaEthiopiaEuro areaEurope & Central AsiaEurope & Central Asia (excluding high income)Europe & Central Asia (IDA & IBRD countries)European UnionFinlandFragile and conflict affected situationsFranceGabonGeorgiaGermanyGhanaGibraltarGreeceGuatemalaHaitiHeavily indebted poor countries (HIPC)High incomeHondurasHong Kong SAR, ChinaHungaryIBRD onlyIcelandIDA & IBRD totalIDA blendIDA onlyIDA totalIndiaIndonesiaIran, Islamic Rep.IraqIrelandIsraelItalyJamaicaJapanJordanKazakhstanKenyaKorea, Dem. People’s Rep.Korea, Rep.KosovoKuwaitKyrgyz RepublicLate-demographic dividendLatin America & Caribbean Latin America & Caribbean (excluding high income)Latin America & the Caribbean (IDA & IBRD countries)LatviaLeast developed countries: UN classificationLebanonLibyaLithuaniaLow & middle incomeLow incomeLower middle incomeLuxembourgMacedonia, FYRMalaysiaMaltaMauritiusMexicoMiddle East & North AfricaMiddle East & North Africa (excluding high income)Middle East & North Africa (IDA & IBRD countries)Middle incomeMoldovaMongoliaMontenegroMoroccoMozambiqueMyanmarNamibiaNepalNetherlandsNew ZealandNicaraguaNigerNigeriaNorth AmericaNorwayOECD membersOmanOther small statesPakistanPanamaParaguayPeruPhilippinesPolandPortugalPost-demographic dividendPre-demographic dividendQatarRomaniaRussian FederationSaudi ArabiaSenegalSerbiaSingaporeSlovak RepublicSloveniaSmall statesSouth AfricaSouth AsiaSouth Asia (IDA & IBRD)South SudanSpainSri LankaSub-Saharan Africa Sub-Saharan Africa (excluding high income)Sub-Saharan Africa (IDA & IBRD countries)SudanSwedenSwitzerlandSyrian Arab RepublicTajikistanTanzaniaThailandTogoTrinidad and TobagoTunisiaTurkeyTurkmenistanUkraineUnited Arab EmiratesUnited KingdomUnited StatesUpper middle incomeUruguayUzbekistanVenezuela, RBVietnamWorldYemen, Rep.ZambiaZimbabwe Linea del tempo:
Questa scala temporale mostra un grafico dal 1972 anno al 2014 anno. Romania. I dati fino ad 1971 anno non disponibili. Il numero di osservazioni attuali secondo i date: 43.
La fonte (nome):
Indicatori dello sviluppo mondiale
La fonte (organizzazione):
IEA Statistics © OECD/IEA 2014 (http://www.iea.org/stats/index.asp), subject to https://www.iea.org/t&c/termsandconditions/
Categorie:
Environment
sono stati aggiornati
23 apr 2017 anni
Indicatori delle variazioni dei valori per anni
Minima:
0.887
1 gen 2004 anni
Massimo:
18.045
1 gen 1980 anni
Alla data di osservazione
Valore
Variazione assoluta
La variazione rispetto al valore precedente
1 gen 1972 anni
11.566
+11.566
0.0%
1 gen 1973 anni
11.3
-0.266
-2.3%
1 gen 1974 anni
12.991
+1.691
14.97%
1 gen 1975 anni
9.948
-3.043
-23.42%
1 gen 1976 anni
10.166
+0.217
2.19%
1 gen 1977 anni
11.272
+1.106
10.88%
1 gen 1978 anni
11.157
-0.115
-1.02%
1 gen 1979 anni
13.996
+2.839
25.45%
1 gen 1980 anni
18.045
+4.049
28.93%
1 gen 1981 anni
17.548
-0.497
-2.75%
1 gen 1982 anni
15.648
-1.9
-10.83%
1 gen 1983 anni
14.525
-1.123
-7.17%
1 gen 1984 anni
14.214
-0.312
-2.15%
1 gen 1985 anni
11.675
-2.539
-17.86%
1 gen 1986 anni
14.8
+3.124
26.76%
1 gen 1987 anni
12.561
-2.238
-15.13%
1 gen 1988 anni
14.777
+2.216
17.64%
1 gen 1989 anni
13.375
-1.402
-9.49%
1 gen 1990 anni
4.166
-9.209
-68.85%
1 gen 1991 anni
4.765
+0.599
14.37%
1 gen 1992 anni
4.841
+0.076
1.59%
1 gen 1993 anni
3.099
-1.741
-35.97%
1 gen 1994 anni
2.229
-0.87
-28.08%
1 gen 1995 anni
1.753
-0.476
-21.34%
1 gen 1996 anni
2.125
+0.372
21.23%
1 gen 1997 anni
1.547
-0.579
-27.22%
1 gen 1998 anni
2.418
+0.871
56.31%
1 gen 1999 anni
2.374
-0.044
-1.83%
1 gen 2000 anni
1.243
-1.131
-47.63%
1 gen 2001 anni
1.31
+0.067
5.42%
1 gen 2002 anni
1.084
-0.227
-17.3%
1 gen 2003 anni
0.935
-0.149
-13.73%
1 gen 2004 anni
0.887
-0.048
-5.17%
1 gen 2005 anni
1.269
+0.383
43.15%
1 gen 2006 anni
1.403
+0.134
10.54%
1 gen 2007 anni
1.154
-0.249
-17.75%
1 gen 2008 anni
1.535
+0.381
33.06%
1 gen 2009 anni
1.589
+0.054
3.49%
1 gen 2010 anni
1.497
-0.092
-5.77%
1 gen 2011 anni
1.565
+0.068
4.52%
1 gen 2012 anni
1.916
+0.351
22.42%
1 gen 2013 anni
2.175
+0.259
13.54%
1 gen 2014 anni
2.063
-0.113
-5.17%
Classificazione dei paesi secondo i statistiche attuali per anni


Commenti: