29
/it/
it
AIzaSyAYiBZKx7MnpbEhh9jyipgxe19OcubqV5w
April 1, 2024
53582
Other small states
OSS
false
2
1
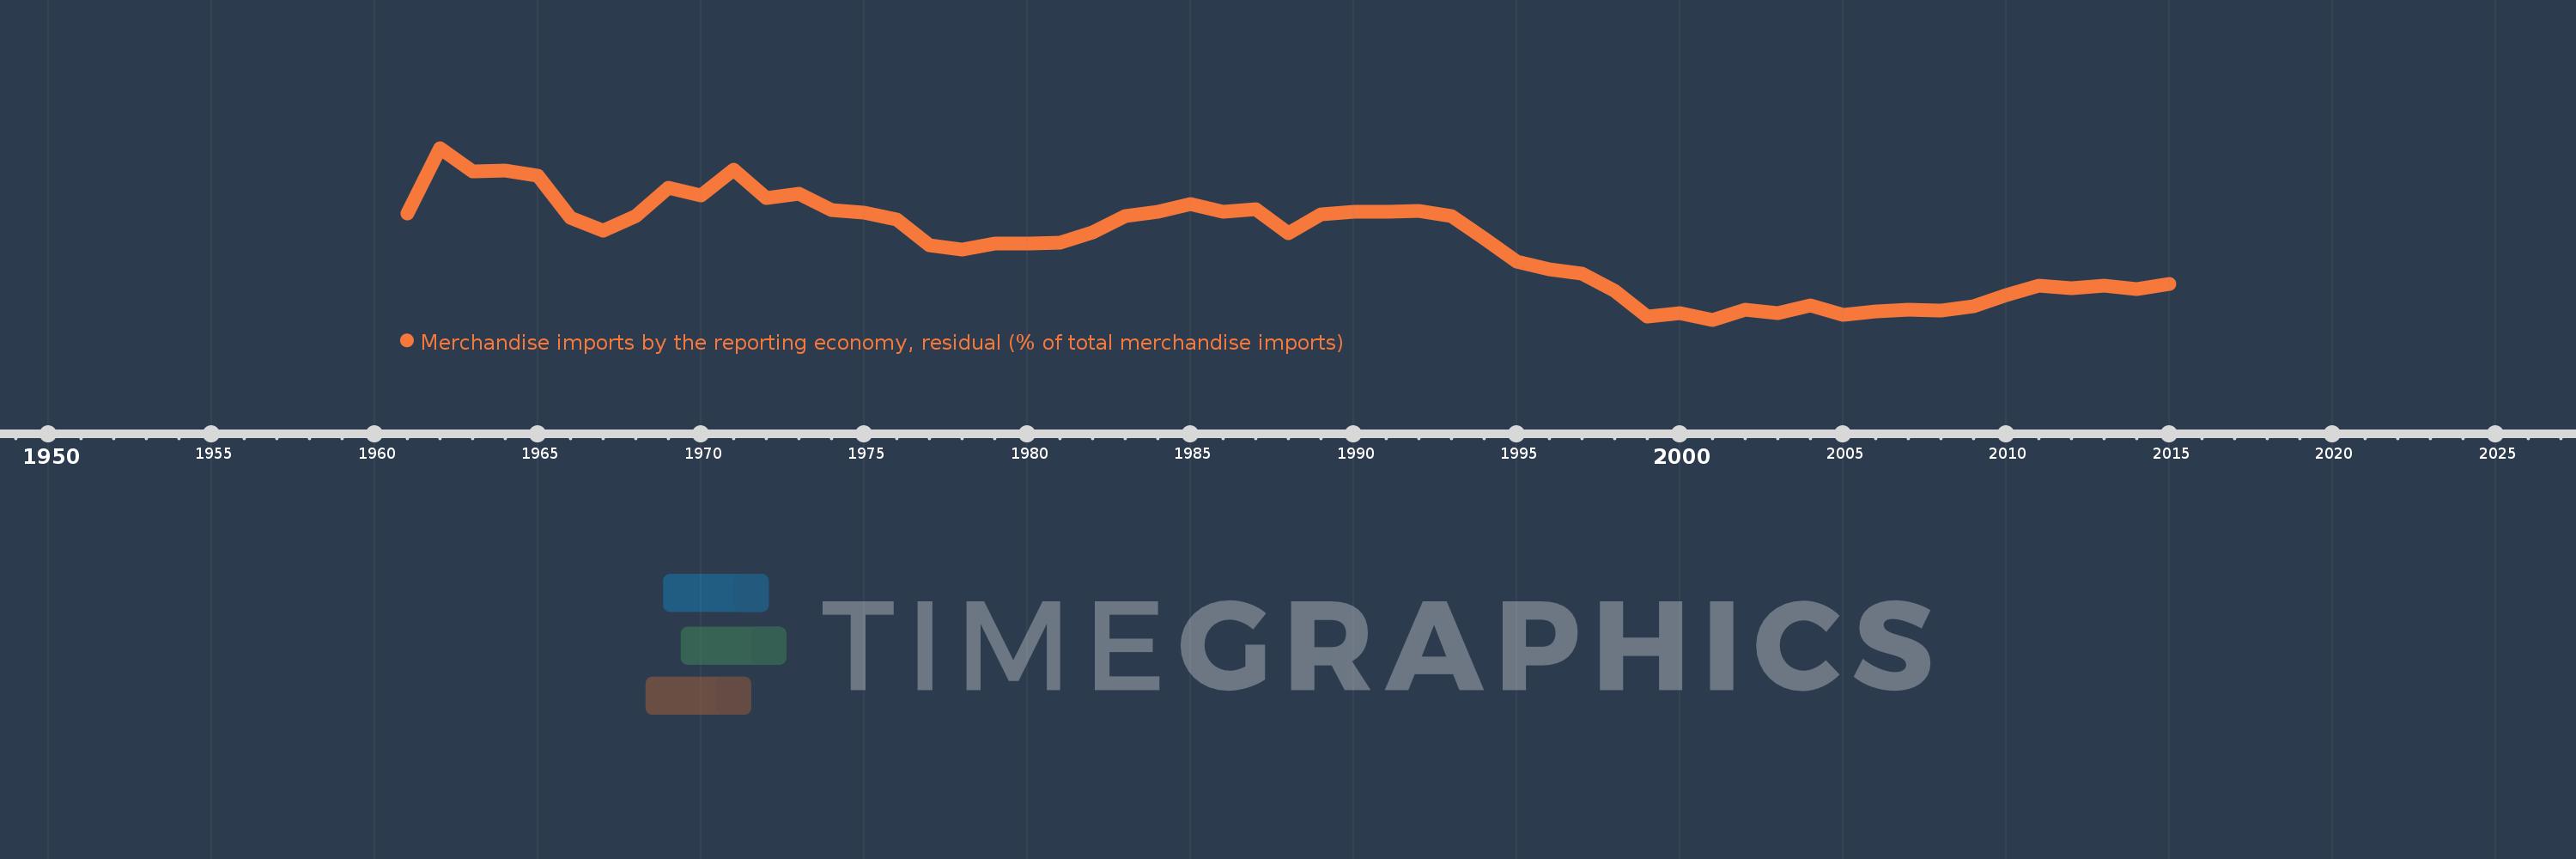
Merchandise imports by the reporting economy, residual (% of total merchandise imports)
2015,2014,2013,2012,2011,2010,2009,2008,2007,2006,2005,2004,2003,2002,2001,2000,1999,1998,1997,1996,1995,1994,1993,1992,1991,1990,1989,1988,1987,1986,1985,1984,1983,1982,1981,1980,1979,1978,1977,1976,1975,1974,1973,1972,1971,1970,1969,1968,1967,1966,1965,1964,1963,1962,1961
Queste statistiche in altri paesi:
AfghanistanAlbaniaAlgeriaAmerican SamoaAngolaAntigua and BarbudaArab WorldArgentinaArmeniaArubaAustraliaAustriaAzerbaijanBahamas, TheBahrainBangladeshBarbadosBelarusBelgiumBelizeBeninBermudaBoliviaBosnia and HerzegovinaBrazilBrunei DarussalamBulgariaBurkina FasoBurundiCabo VerdeCambodiaCameroonCanadaCaribbean small statesCentral African RepublicCentral Europe and the BalticsChadChileChinaColombiaComorosCongo, Dem. Rep.Congo, Rep.Costa RicaCote d'IvoireCroatiaCubaCyprusCzech RepublicDenmarkDjiboutiDominicaDominican RepublicEarly-demographic dividendEast Asia & PacificEast Asia & Pacific (excluding high income)East Asia & Pacific (IDA & IBRD countries)EcuadorEgypt, Arab Rep.El SalvadorEquatorial GuineaEstoniaEthiopiaEuro areaEurope & Central AsiaEurope & Central Asia (excluding high income)Europe & Central Asia (IDA & IBRD countries)European UnionFaroe IslandsFijiFinlandFragile and conflict affected situationsFranceFrench PolynesiaGabonGambia, TheGeorgiaGermanyGhanaGibraltarGreeceGreenlandGrenadaGuamGuatemalaGuineaGuinea-BissauGuyanaHaitiHeavily indebted poor countries (HIPC)High incomeHondurasHong Kong SAR, ChinaHungaryIBRD onlyIcelandIDA & IBRD totalIDA blendIDA onlyIDA totalIndiaIndonesiaIran, Islamic Rep.IraqIrelandIsraelItalyJamaicaJapanJordanKazakhstanKenyaKiribatiKorea, Dem. People’s Rep.Korea, Rep.KosovoKuwaitKyrgyz RepublicLao PDRLate-demographic dividendLatin America & Caribbean Latin America & Caribbean (excluding high income)Latin America & the Caribbean (IDA & IBRD countries)LatviaLeast developed countries: UN classificationLebanonLiberiaLibyaLithuaniaLow & middle incomeLow incomeLower middle incomeLuxembourgMacao SAR, ChinaMacedonia, FYRMadagascarMalawiMalaysiaMaldivesMaliMaltaMauritaniaMauritiusMexicoMiddle East & North AfricaMiddle East & North Africa (excluding high income)Middle East & North Africa (IDA & IBRD countries)Middle incomeMoldovaMongoliaMontenegroMoroccoMozambiqueMyanmarNauruNepalNetherlandsNew CaledoniaNew ZealandNicaraguaNigerNigeriaNorth AmericaNorwayOECD membersOmanOther small statesPacific island small statesPakistanPanamaPapua New GuineaParaguayPeruPhilippinesPolandPortugalPost-demographic dividendPre-demographic dividendQatarRomaniaRussian FederationRwandaSamoaSao Tome and PrincipeSaudi ArabiaSenegalSerbiaSeychellesSierra LeoneSingaporeSlovak RepublicSloveniaSmall statesSolomon IslandsSomaliaSouth AfricaSouth AsiaSouth Asia (IDA & IBRD)SpainSri LankaSt. Kitts and NevisSt. LuciaSt. Vincent and the GrenadinesSub-Saharan Africa Sub-Saharan Africa (excluding high income)Sub-Saharan Africa (IDA & IBRD countries)SudanSurinameSwedenSwitzerlandSyrian Arab RepublicTajikistanTanzaniaThailandTogoTongaTrinidad and TobagoTunisiaTurkeyTurkmenistanTuvaluUgandaUkraineUnited Arab EmiratesUnited KingdomUnited StatesUpper middle incomeUruguayUzbekistanVanuatuVenezuela, RBVietnamWorldYemen, Rep.ZambiaZimbabwe Linea del tempo:
Questa scala temporale mostra un grafico dal 1961 anno al 2015 anno. Other small states. I dati fino ad 1960 anno non disponibili. Il numero di osservazioni attuali secondo i date: 55.
La fonte (nome):
Indicatori dello sviluppo mondiale
La fonte (organizzazione):
World Bank staff estimates based data from International Monetary Fund's Direction of Trade database.
Categorie:
Private Sector, Trade
sono stati aggiornati
23 apr 2017 anni
Indicatori delle variazioni dei valori per anni
Minima:
1.7
1 gen 2001 anni
Massimo:
15.243
1 gen 1962 anni
Alla data di osservazione
Valore
Variazione assoluta
La variazione rispetto al valore precedente
1 gen 1961 anni
10.061
+10.061
0.0%
1 gen 1962 anni
15.243
+5.182
51.51%
1 gen 1963 anni
13.387
-1.856
-12.18%
1 gen 1964 anni
13.479
+0.093
0.69%
1 gen 1965 anni
13.057
-0.422
-3.13%
1 gen 1966 anni
9.717
-3.34
-25.58%
1 gen 1967 anni
8.754
-0.964
-9.92%
1 gen 1968 anni
9.877
+1.123
12.83%
1 gen 1969 anni
12.13
+2.253
22.81%
1 gen 1970 anni
11.512
-0.618
-5.09%
1 gen 1971 anni
13.537
+2.025
17.59%
1 gen 1972 anni
11.291
-2.246
-16.59%
1 gen 1973 anni
11.606
+0.316
2.79%
1 gen 1974 anni
10.335
-1.272
-10.96%
1 gen 1975 anni
10.131
-0.204
-1.97%
1 gen 1976 anni
9.605
-0.526
-5.19%
1 gen 1977 anni
7.592
-2.013
-20.96%
1 gen 1978 anni
7.26
-0.332
-4.37%
1 gen 1979 anni
7.736
+0.476
6.56%
1 gen 1980 anni
7.713
-0.023
-0.3%
1 gen 1981 anni
7.746
+0.033
0.43%
1 gen 1982 anni
8.581
+0.835
10.78%
1 gen 1983 anni
9.883
+1.302
15.18%
1 gen 1984 anni
10.236
+0.353
3.57%
1 gen 1985 anni
10.844
+0.607
5.93%
1 gen 1986 anni
10.223
-0.62
-5.72%
1 gen 1987 anni
10.414
+0.191
1.86%
1 gen 1988 anni
8.531
-1.883
-18.08%
1 gen 1989 anni
9.994
+1.463
17.14%
1 gen 1990 anni
10.231
+0.237
2.37%
1 gen 1991 anni
10.216
-0.014
-0.14%
1 gen 1992 anni
10.256
+0.04
0.39%
1 gen 1993 anni
9.875
-0.382
-3.72%
1 gen 1994 anni
8.089
-1.786
-18.08%
1 gen 1995 anni
6.253
-1.836
-22.7%
1 gen 1996 anni
5.682
-0.57
-9.12%
1 gen 1997 anni
5.349
-0.334
-5.88%
1 gen 1998 anni
4.004
-1.344
-25.13%
1 gen 1999 anni
1.918
-2.086
-52.09%
1 gen 2000 anni
2.205
+0.286
14.92%
1 gen 2001 anni
1.7
-0.505
-22.91%
1 gen 2002 anni
2.465
+0.766
45.05%
1 gen 2003 anni
2.241
-0.224
-9.11%
1 gen 2004 anni
2.858
+0.617
27.54%
1 gen 2005 anni
2.085
-0.773
-27.04%
1 gen 2006 anni
2.352
+0.267
12.8%
1 gen 2007 anni
2.461
+0.109
4.63%
1 gen 2008 anni
2.403
-0.058
-2.36%
1 gen 2009 anni
2.78
+0.378
15.72%
1 gen 2010 anni
3.649
+0.868
31.22%
1 gen 2011 anni
4.381
+0.732
20.07%
1 gen 2012 anni
4.174
-0.207
-4.73%
1 gen 2013 anni
4.395
+0.221
5.31%
1 gen 2014 anni
4.145
-0.25
-5.68%
1 gen 2015 anni
4.518
+0.372
8.98%
Classificazione dei paesi secondo i statistiche attuali per anni


Commenti: