29
/it/
it
AIzaSyAYiBZKx7MnpbEhh9jyipgxe19OcubqV5w
April 1, 2024
239562
Sierra Leone
SLE
true
2
1
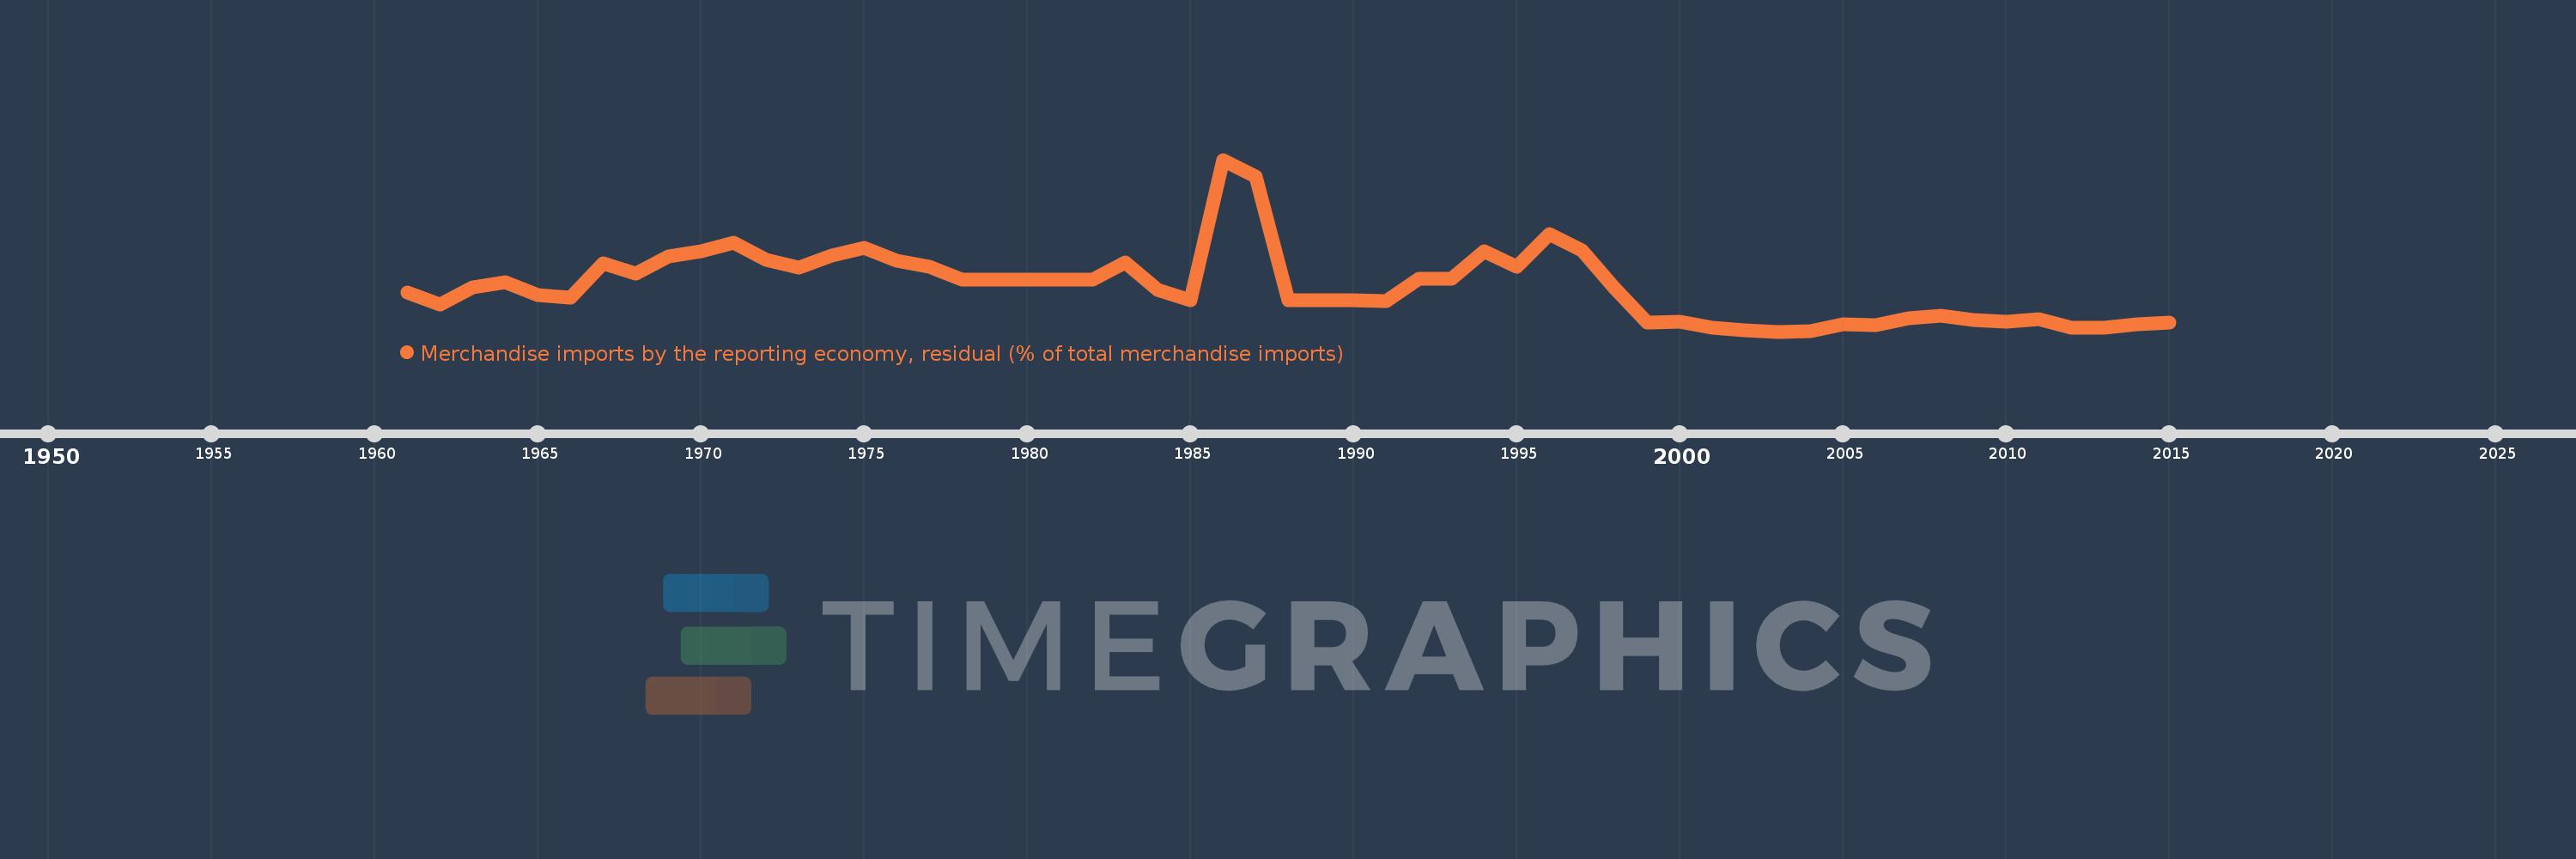
Merchandise imports by the reporting economy, residual (% of total merchandise imports)
2015,2014,2013,2012,2011,2010,2009,2008,2007,2006,2005,2004,2003,2002,2001,2000,1999,1998,1997,1996,1995,1994,1993,1992,1991,1990,1989,1988,1987,1986,1985,1984,1983,1982,1978,1977,1976,1975,1974,1973,1972,1971,1970,1969,1968,1967,1966,1965,1964,1963,1962,1961
Queste statistiche in altri paesi:
AfghanistanAlbaniaAlgeriaAmerican SamoaAngolaAntigua and BarbudaArab WorldArgentinaArmeniaArubaAustraliaAustriaAzerbaijanBahamas, TheBahrainBangladeshBarbadosBelarusBelgiumBelizeBeninBermudaBoliviaBosnia and HerzegovinaBrazilBrunei DarussalamBulgariaBurkina FasoBurundiCabo VerdeCambodiaCameroonCanadaCaribbean small statesCentral African RepublicCentral Europe and the BalticsChadChileChinaColombiaComorosCongo, Dem. Rep.Congo, Rep.Costa RicaCote d'IvoireCroatiaCubaCyprusCzech RepublicDenmarkDjiboutiDominicaDominican RepublicEarly-demographic dividendEast Asia & PacificEast Asia & Pacific (excluding high income)East Asia & Pacific (IDA & IBRD countries)EcuadorEgypt, Arab Rep.El SalvadorEquatorial GuineaEstoniaEthiopiaEuro areaEurope & Central AsiaEurope & Central Asia (excluding high income)Europe & Central Asia (IDA & IBRD countries)European UnionFaroe IslandsFijiFinlandFragile and conflict affected situationsFranceFrench PolynesiaGabonGambia, TheGeorgiaGermanyGhanaGibraltarGreeceGreenlandGrenadaGuamGuatemalaGuineaGuinea-BissauGuyanaHaitiHeavily indebted poor countries (HIPC)High incomeHondurasHong Kong SAR, ChinaHungaryIBRD onlyIcelandIDA & IBRD totalIDA blendIDA onlyIDA totalIndiaIndonesiaIran, Islamic Rep.IraqIrelandIsraelItalyJamaicaJapanJordanKazakhstanKenyaKiribatiKorea, Dem. People’s Rep.Korea, Rep.KosovoKuwaitKyrgyz RepublicLao PDRLate-demographic dividendLatin America & Caribbean Latin America & Caribbean (excluding high income)Latin America & the Caribbean (IDA & IBRD countries)LatviaLeast developed countries: UN classificationLebanonLiberiaLibyaLithuaniaLow & middle incomeLow incomeLower middle incomeLuxembourgMacao SAR, ChinaMacedonia, FYRMadagascarMalawiMalaysiaMaldivesMaliMaltaMauritaniaMauritiusMexicoMiddle East & North AfricaMiddle East & North Africa (excluding high income)Middle East & North Africa (IDA & IBRD countries)Middle incomeMoldovaMongoliaMontenegroMoroccoMozambiqueMyanmarNauruNepalNetherlandsNew CaledoniaNew ZealandNicaraguaNigerNigeriaNorth AmericaNorwayOECD membersOmanOther small statesPacific island small statesPakistanPanamaPapua New GuineaParaguayPeruPhilippinesPolandPortugalPost-demographic dividendPre-demographic dividendQatarRomaniaRussian FederationRwandaSamoaSao Tome and PrincipeSaudi ArabiaSenegalSerbiaSeychellesSierra LeoneSingaporeSlovak RepublicSloveniaSmall statesSolomon IslandsSomaliaSouth AfricaSouth AsiaSouth Asia (IDA & IBRD)SpainSri LankaSt. Kitts and NevisSt. LuciaSt. Vincent and the GrenadinesSub-Saharan Africa Sub-Saharan Africa (excluding high income)Sub-Saharan Africa (IDA & IBRD countries)SudanSurinameSwedenSwitzerlandSyrian Arab RepublicTajikistanTanzaniaThailandTogoTongaTrinidad and TobagoTunisiaTurkeyTurkmenistanTuvaluUgandaUkraineUnited Arab EmiratesUnited KingdomUnited StatesUpper middle incomeUruguayUzbekistanVanuatuVenezuela, RBVietnamWorldYemen, Rep.ZambiaZimbabwe Linea del tempo:
Questa scala temporale mostra un grafico dal 1961 anno al 2015 anno. Sierra Leone. I dati fino ad 1960 anno non disponibili. Il numero di osservazioni attuali secondo i date: 52.
La fonte (nome):
Indicatori dello sviluppo mondiale
La fonte (organizzazione):
World Bank staff estimates based data from International Monetary Fund's Direction of Trade database.
Categorie:
Private Sector, Trade
sono stati aggiornati
23 apr 2017 anni
Indicatori delle variazioni dei valori per anni
Minima:
2.651
1 gen 2003 anni
Massimo:
39.103
1 gen 1986 anni
Alla data di osservazione
Valore
Variazione assoluta
La variazione rispetto al valore precedente
1 gen 1961 anni
11.019
+11.019
0.0%
1 gen 1962 anni
8.454
-2.565
-23.28%
1 gen 1963 anni
12.096
+3.642
43.08%
1 gen 1964 anni
13.133
+1.037
8.57%
1 gen 1965 anni
10.331
-2.802
-21.33%
1 gen 1966 anni
9.777
-0.554
-5.37%
1 gen 1967 anni
17.1
+7.323
74.91%
1 gen 1968 anni
14.939
-2.161
-12.64%
1 gen 1969 anni
18.547
+3.609
24.16%
1 gen 1970 anni
19.655
+1.107
5.97%
1 gen 1971 anni
21.587
+1.932
9.83%
1 gen 1972 anni
17.846
-3.741
-17.33%
1 gen 1973 anni
16.208
-1.638
-9.18%
1 gen 1974 anni
18.816
+2.608
16.09%
1 gen 1975 anni
20.379
+1.563
8.31%
1 gen 1976 anni
17.682
-2.697
-13.23%
1 gen 1977 anni
16.324
-1.358
-7.68%
1 gen 1978 anni
13.748
-2.575
-15.78%
1 gen 1982 anni
13.748
0.0
0.0%
1 gen 1983 anni
17.346
+3.597
26.16%
1 gen 1984 anni
11.491
-5.854
-33.75%
1 gen 1985 anni
9.297
-2.195
-19.1%
1 gen 1986 anni
39.103
+29.806
320.61%
1 gen 1987 anni
35.505
-3.597
-9.2%
1 gen 1988 anni
9.297
-26.209
-73.82%
1 gen 1989 anni
9.297
0.0
0.0%
1 gen 1990 anni
9.297
+0.0
0.0%
1 gen 1991 anni
9.159
-0.138
-1.48%
1 gen 1992 anni
13.917
+4.758
51.95%
1 gen 1993 anni
13.892
-0.025
-0.18%
1 gen 1994 anni
19.715
+5.822
41.91%
1 gen 1995 anni
16.474
-3.24
-16.44%
1 gen 1996 anni
23.294
+6.819
41.39%
1 gen 1997 anni
19.955
-3.339
-14.33%
1 gen 1998 anni
11.917
-8.038
-40.28%
1 gen 1999 anni
4.588
-7.328
-61.5%
1 gen 2000 anni
4.787
+0.199
4.33%
1 gen 2001 anni
3.466
-1.321
-27.6%
1 gen 2002 anni
2.837
-0.629
-18.15%
1 gen 2003 anni
2.651
-0.185
-6.54%
1 gen 2004 anni
2.758
+0.107
4.03%
1 gen 2005 anni
4.16
+1.402
50.84%
1 gen 2006 anni
4.095
-0.065
-1.57%
1 gen 2007 anni
5.548
+1.453
35.48%
1 gen 2008 anni
6.1
+0.552
9.95%
1 gen 2009 anni
5.065
-1.035
-16.97%
1 gen 2010 anni
4.712
-0.353
-6.98%
1 gen 2011 anni
5.352
+0.64
13.59%
1 gen 2012 anni
3.469
-1.883
-35.18%
1 gen 2013 anni
3.405
-0.064
-1.84%
1 gen 2014 anni
4.162
+0.757
22.23%
1 gen 2015 anni
4.628
+0.466
11.19%
Classificazione dei paesi secondo i statistiche attuali per anni


Commenti: