29
/it/
it
AIzaSyAYiBZKx7MnpbEhh9jyipgxe19OcubqV5w
April 1, 2024
144670
Guatemala
GTM
true
2
1
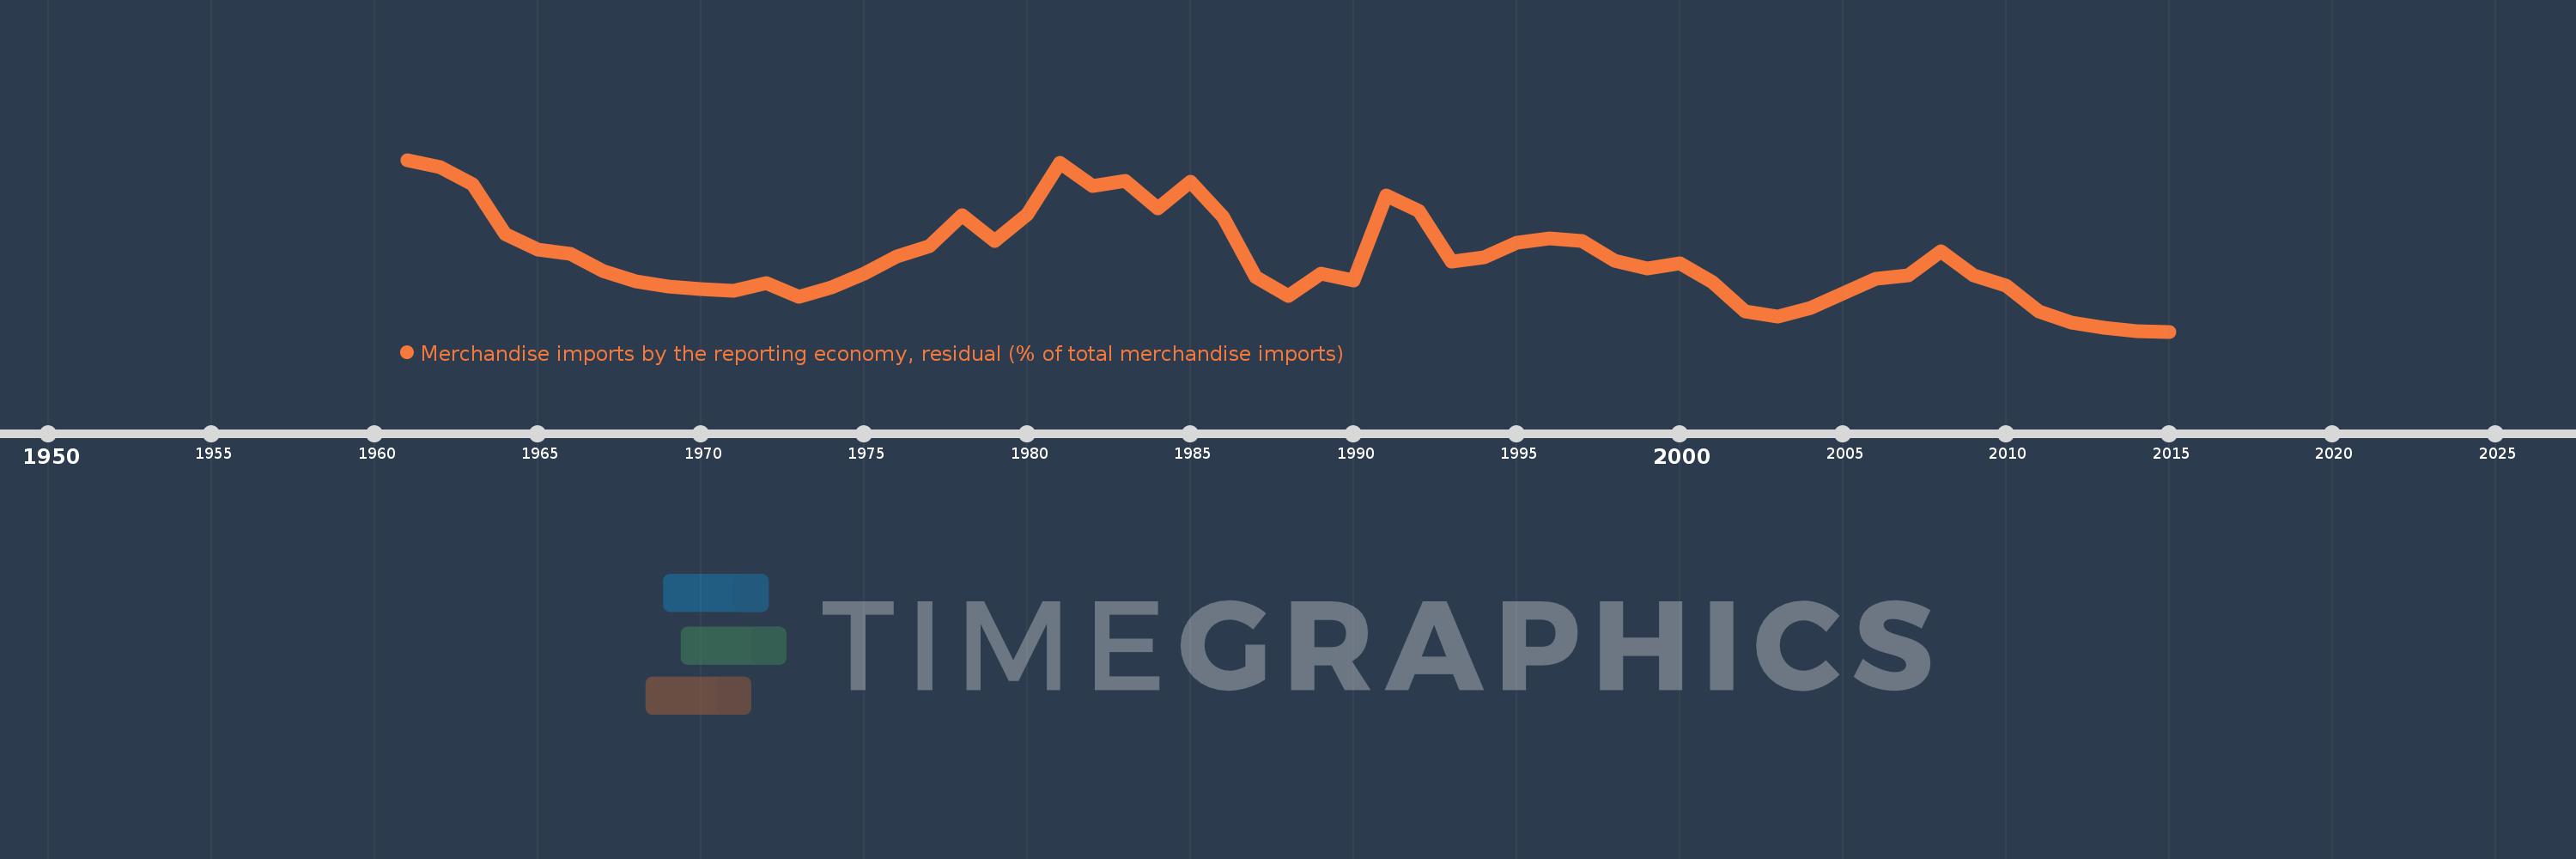
Merchandise imports by the reporting economy, residual (% of total merchandise imports)
2015,2014,2013,2012,2011,2010,2009,2008,2007,2006,2005,2004,2003,2002,2001,2000,1999,1998,1997,1996,1995,1994,1993,1992,1991,1990,1989,1988,1987,1986,1985,1984,1983,1982,1981,1980,1979,1978,1977,1976,1975,1974,1973,1972,1971,1970,1969,1968,1967,1966,1965,1964,1963,1962,1961
Queste statistiche in altri paesi:
AfghanistanAlbaniaAlgeriaAmerican SamoaAngolaAntigua and BarbudaArab WorldArgentinaArmeniaArubaAustraliaAustriaAzerbaijanBahamas, TheBahrainBangladeshBarbadosBelarusBelgiumBelizeBeninBermudaBoliviaBosnia and HerzegovinaBrazilBrunei DarussalamBulgariaBurkina FasoBurundiCabo VerdeCambodiaCameroonCanadaCaribbean small statesCentral African RepublicCentral Europe and the BalticsChadChileChinaColombiaComorosCongo, Dem. Rep.Congo, Rep.Costa RicaCote d'IvoireCroatiaCubaCyprusCzech RepublicDenmarkDjiboutiDominicaDominican RepublicEarly-demographic dividendEast Asia & PacificEast Asia & Pacific (excluding high income)East Asia & Pacific (IDA & IBRD countries)EcuadorEgypt, Arab Rep.El SalvadorEquatorial GuineaEstoniaEthiopiaEuro areaEurope & Central AsiaEurope & Central Asia (excluding high income)Europe & Central Asia (IDA & IBRD countries)European UnionFaroe IslandsFijiFinlandFragile and conflict affected situationsFranceFrench PolynesiaGabonGambia, TheGeorgiaGermanyGhanaGibraltarGreeceGreenlandGrenadaGuamGuatemalaGuineaGuinea-BissauGuyanaHaitiHeavily indebted poor countries (HIPC)High incomeHondurasHong Kong SAR, ChinaHungaryIBRD onlyIcelandIDA & IBRD totalIDA blendIDA onlyIDA totalIndiaIndonesiaIran, Islamic Rep.IraqIrelandIsraelItalyJamaicaJapanJordanKazakhstanKenyaKiribatiKorea, Dem. People’s Rep.Korea, Rep.KosovoKuwaitKyrgyz RepublicLao PDRLate-demographic dividendLatin America & Caribbean Latin America & Caribbean (excluding high income)Latin America & the Caribbean (IDA & IBRD countries)LatviaLeast developed countries: UN classificationLebanonLiberiaLibyaLithuaniaLow & middle incomeLow incomeLower middle incomeLuxembourgMacao SAR, ChinaMacedonia, FYRMadagascarMalawiMalaysiaMaldivesMaliMaltaMauritaniaMauritiusMexicoMiddle East & North AfricaMiddle East & North Africa (excluding high income)Middle East & North Africa (IDA & IBRD countries)Middle incomeMoldovaMongoliaMontenegroMoroccoMozambiqueMyanmarNauruNepalNetherlandsNew CaledoniaNew ZealandNicaraguaNigerNigeriaNorth AmericaNorwayOECD membersOmanOther small statesPacific island small statesPakistanPanamaPapua New GuineaParaguayPeruPhilippinesPolandPortugalPost-demographic dividendPre-demographic dividendQatarRomaniaRussian FederationRwandaSamoaSao Tome and PrincipeSaudi ArabiaSenegalSerbiaSeychellesSierra LeoneSingaporeSlovak RepublicSloveniaSmall statesSolomon IslandsSomaliaSouth AfricaSouth AsiaSouth Asia (IDA & IBRD)SpainSri LankaSt. Kitts and NevisSt. LuciaSt. Vincent and the GrenadinesSub-Saharan Africa Sub-Saharan Africa (excluding high income)Sub-Saharan Africa (IDA & IBRD countries)SudanSurinameSwedenSwitzerlandSyrian Arab RepublicTajikistanTanzaniaThailandTogoTongaTrinidad and TobagoTunisiaTurkeyTurkmenistanTuvaluUgandaUkraineUnited Arab EmiratesUnited KingdomUnited StatesUpper middle incomeUruguayUzbekistanVanuatuVenezuela, RBVietnamWorldYemen, Rep.ZambiaZimbabwe Linea del tempo:
Questa scala temporale mostra un grafico dal 1961 anno al 2015 anno. Guatemala. I dati fino ad 1960 anno non disponibili. Il numero di osservazioni attuali secondo i date: 55.
La fonte (nome):
Indicatori dello sviluppo mondiale
La fonte (organizzazione):
World Bank staff estimates based data from International Monetary Fund's Direction of Trade database.
Categorie:
Private Sector, Trade
sono stati aggiornati
23 apr 2017 anni
Indicatori delle variazioni dei valori per anni
Minima:
0.006
1 gen 2015 anni
Massimo:
9.783
1 gen 1961 anni
Alla data di osservazione
Valore
Variazione assoluta
La variazione rispetto al valore precedente
1 gen 1961 anni
9.783
+9.783
0.0%
1 gen 1962 anni
9.391
-0.391
-4.0%
1 gen 1963 anni
8.388
-1.003
-10.68%
1 gen 1964 anni
5.576
-2.812
-33.53%
1 gen 1965 anni
4.665
-0.911
-16.33%
1 gen 1966 anni
4.45
-0.215
-4.6%
1 gen 1967 anni
3.433
-1.017
-22.85%
1 gen 1968 anni
2.866
-0.567
-16.51%
1 gen 1969 anni
2.566
-0.3
-10.47%
1 gen 1970 anni
2.412
-0.155
-6.02%
1 gen 1971 anni
2.344
-0.068
-2.81%
1 gen 1972 anni
2.79
+0.446
19.01%
1 gen 1973 anni
1.97
-0.82
-29.39%
1 gen 1974 anni
2.526
+0.557
28.27%
1 gen 1975 anni
3.324
+0.798
31.58%
1 gen 1976 anni
4.265
+0.94
28.29%
1 gen 1977 anni
4.87
+0.606
14.2%
1 gen 1978 anni
6.636
+1.765
36.24%
1 gen 1979 anni
5.174
-1.462
-22.03%
1 gen 1980 anni
6.676
+1.502
29.04%
1 gen 1981 anni
9.596
+2.92
43.74%
1 gen 1982 anni
8.29
-1.306
-13.61%
1 gen 1983 anni
8.562
+0.273
3.29%
1 gen 1984 anni
7.024
-1.539
-17.97%
1 gen 1985 anni
8.557
+1.533
21.83%
1 gen 1986 anni
6.515
-2.042
-23.87%
1 gen 1987 anni
3.129
-3.385
-51.97%
1 gen 1988 anni
2.03
-1.1
-35.14%
1 gen 1989 anni
3.312
+1.282
63.18%
1 gen 1990 anni
2.93
-0.382
-11.53%
1 gen 1991 anni
7.758
+4.829
164.81%
1 gen 1992 anni
6.893
-0.866
-11.16%
1 gen 1993 anni
3.985
-2.908
-42.19%
1 gen 1994 anni
4.256
+0.272
6.81%
1 gen 1995 anni
5.075
+0.818
19.22%
1 gen 1996 anni
5.29
+0.215
4.24%
1 gen 1997 anni
5.144
-0.146
-2.75%
1 gen 1998 anni
4.04
-1.104
-21.46%
1 gen 1999 anni
3.584
-0.456
-11.3%
1 gen 2000 anni
3.886
+0.302
8.43%
1 gen 2001 anni
2.804
-1.082
-27.84%
1 gen 2002 anni
1.156
-1.648
-58.76%
1 gen 2003 anni
0.845
-0.311
-26.89%
1 gen 2004 anni
1.346
+0.5
59.19%
1 gen 2005 anni
2.177
+0.831
61.73%
1 gen 2006 anni
3.031
+0.854
39.24%
1 gen 2007 anni
3.216
+0.186
6.13%
1 gen 2008 anni
4.569
+1.352
42.04%
1 gen 2009 anni
3.205
-1.364
-29.85%
1 gen 2010 anni
2.636
-0.569
-17.75%
1 gen 2011 anni
1.162
-1.474
-55.93%
1 gen 2012 anni
0.534
-0.627
-54.02%
1 gen 2013 anni
0.23
-0.304
-56.94%
1 gen 2014 anni
0.017
-0.213
-92.7%
1 gen 2015 anni
0.006
-0.011
-66.47%
Classificazione dei paesi secondo i statistiche attuali per anni


Commenti: