29
/it/
it
AIzaSyAYiBZKx7MnpbEhh9jyipgxe19OcubqV5w
April 1, 2024
180147
Libya
LBY
true
2
1
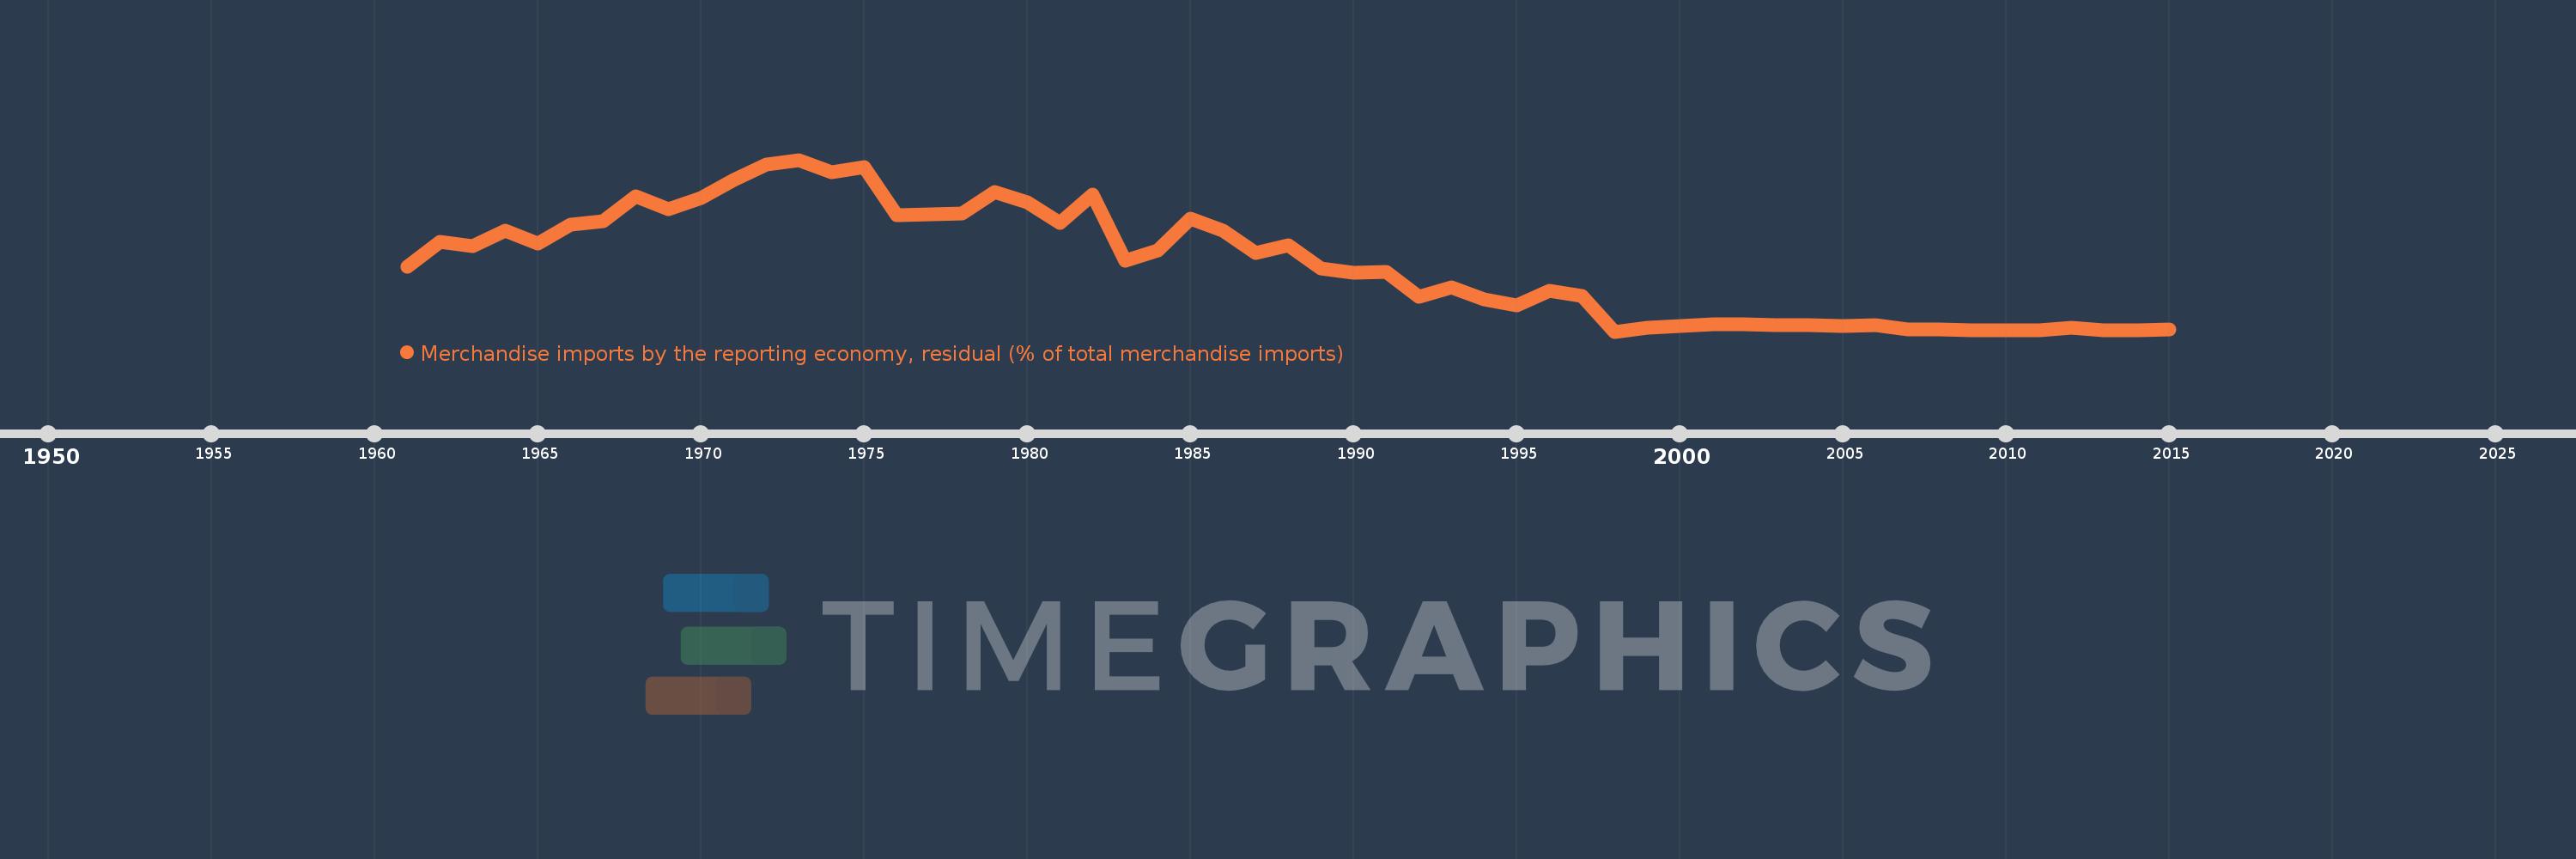
Merchandise imports by the reporting economy, residual (% of total merchandise imports)
2015,2014,2013,2012,2011,2010,2009,2008,2007,2006,2005,2004,2003,2002,2001,2000,1999,1998,1997,1996,1995,1994,1993,1992,1991,1990,1989,1988,1987,1986,1985,1984,1983,1982,1981,1980,1979,1978,1977,1976,1975,1974,1973,1972,1971,1970,1969,1968,1967,1966,1965,1964,1963,1962,1961
Queste statistiche in altri paesi:
AfghanistanAlbaniaAlgeriaAmerican SamoaAngolaAntigua and BarbudaArab WorldArgentinaArmeniaArubaAustraliaAustriaAzerbaijanBahamas, TheBahrainBangladeshBarbadosBelarusBelgiumBelizeBeninBermudaBoliviaBosnia and HerzegovinaBrazilBrunei DarussalamBulgariaBurkina FasoBurundiCabo VerdeCambodiaCameroonCanadaCaribbean small statesCentral African RepublicCentral Europe and the BalticsChadChileChinaColombiaComorosCongo, Dem. Rep.Congo, Rep.Costa RicaCote d'IvoireCroatiaCubaCyprusCzech RepublicDenmarkDjiboutiDominicaDominican RepublicEarly-demographic dividendEast Asia & PacificEast Asia & Pacific (excluding high income)East Asia & Pacific (IDA & IBRD countries)EcuadorEgypt, Arab Rep.El SalvadorEquatorial GuineaEstoniaEthiopiaEuro areaEurope & Central AsiaEurope & Central Asia (excluding high income)Europe & Central Asia (IDA & IBRD countries)European UnionFaroe IslandsFijiFinlandFragile and conflict affected situationsFranceFrench PolynesiaGabonGambia, TheGeorgiaGermanyGhanaGibraltarGreeceGreenlandGrenadaGuamGuatemalaGuineaGuinea-BissauGuyanaHaitiHeavily indebted poor countries (HIPC)High incomeHondurasHong Kong SAR, ChinaHungaryIBRD onlyIcelandIDA & IBRD totalIDA blendIDA onlyIDA totalIndiaIndonesiaIran, Islamic Rep.IraqIrelandIsraelItalyJamaicaJapanJordanKazakhstanKenyaKiribatiKorea, Dem. People’s Rep.Korea, Rep.KosovoKuwaitKyrgyz RepublicLao PDRLate-demographic dividendLatin America & Caribbean Latin America & Caribbean (excluding high income)Latin America & the Caribbean (IDA & IBRD countries)LatviaLeast developed countries: UN classificationLebanonLiberiaLibyaLithuaniaLow & middle incomeLow incomeLower middle incomeLuxembourgMacao SAR, ChinaMacedonia, FYRMadagascarMalawiMalaysiaMaldivesMaliMaltaMauritaniaMauritiusMexicoMiddle East & North AfricaMiddle East & North Africa (excluding high income)Middle East & North Africa (IDA & IBRD countries)Middle incomeMoldovaMongoliaMontenegroMoroccoMozambiqueMyanmarNauruNepalNetherlandsNew CaledoniaNew ZealandNicaraguaNigerNigeriaNorth AmericaNorwayOECD membersOmanOther small statesPacific island small statesPakistanPanamaPapua New GuineaParaguayPeruPhilippinesPolandPortugalPost-demographic dividendPre-demographic dividendQatarRomaniaRussian FederationRwandaSamoaSao Tome and PrincipeSaudi ArabiaSenegalSerbiaSeychellesSierra LeoneSingaporeSlovak RepublicSloveniaSmall statesSolomon IslandsSomaliaSouth AfricaSouth AsiaSouth Asia (IDA & IBRD)SpainSri LankaSt. Kitts and NevisSt. LuciaSt. Vincent and the GrenadinesSub-Saharan Africa Sub-Saharan Africa (excluding high income)Sub-Saharan Africa (IDA & IBRD countries)SudanSurinameSwedenSwitzerlandSyrian Arab RepublicTajikistanTanzaniaThailandTogoTongaTrinidad and TobagoTunisiaTurkeyTurkmenistanTuvaluUgandaUkraineUnited Arab EmiratesUnited KingdomUnited StatesUpper middle incomeUruguayUzbekistanVanuatuVenezuela, RBVietnamWorldYemen, Rep.ZambiaZimbabwe Linea del tempo:
Questa scala temporale mostra un grafico dal 1961 anno al 2015 anno. Libya. I dati fino ad 1960 anno non disponibili. Il numero di osservazioni attuali secondo i date: 55.
La fonte (nome):
Indicatori dello sviluppo mondiale
La fonte (organizzazione):
World Bank staff estimates based data from International Monetary Fund's Direction of Trade database.
Categorie:
Private Sector, Trade
sono stati aggiornati
23 apr 2017 anni
Indicatori delle variazioni dei valori per anni
Minima:
0.001
1 gen 1998 anni
Massimo:
15.472
1 gen 1973 anni
Alla data di osservazione
Valore
Variazione assoluta
La variazione rispetto al valore precedente
1 gen 1961 anni
5.818
+5.818
0.0%
1 gen 1962 anni
8.11
+2.292
39.39%
1 gen 1963 anni
7.733
-0.376
-4.64%
1 gen 1964 anni
9.057
+1.323
17.11%
1 gen 1965 anni
7.906
-1.151
-12.71%
1 gen 1966 anni
9.631
+1.725
21.83%
1 gen 1967 anni
9.963
+0.332
3.45%
1 gen 1968 anni
12.176
+2.213
22.21%
1 gen 1969 anni
11.024
-1.152
-9.46%
1 gen 1970 anni
12.049
+1.024
9.29%
1 gen 1971 anni
13.645
+1.596
13.25%
1 gen 1972 anni
15.074
+1.43
10.48%
1 gen 1973 anni
15.472
+0.397
2.64%
1 gen 1974 anni
14.348
-1.124
-7.26%
1 gen 1975 anni
14.844
+0.496
3.46%
1 gen 1976 anni
10.463
-4.381
-29.51%
1 gen 1977 anni
10.548
+0.085
0.81%
1 gen 1978 anni
10.65
+0.103
0.97%
1 gen 1979 anni
12.557
+1.907
17.9%
1 gen 1980 anni
11.651
-0.906
-7.22%
1 gen 1981 anni
9.786
-1.865
-16.01%
1 gen 1982 anni
12.363
+2.577
26.33%
1 gen 1983 anni
6.42
-5.943
-48.07%
1 gen 1984 anni
7.281
+0.861
13.41%
1 gen 1985 anni
10.176
+2.895
39.76%
1 gen 1986 anni
9.09
-1.086
-10.67%
1 gen 1987 anni
7.057
-2.033
-22.37%
1 gen 1988 anni
7.76
+0.703
9.96%
1 gen 1989 anni
5.709
-2.05
-26.42%
1 gen 1990 anni
5.3
-0.409
-7.17%
1 gen 1991 anni
5.349
+0.049
0.92%
1 gen 1992 anni
3.1
-2.249
-42.04%
1 gen 1993 anni
3.964
+0.864
27.85%
1 gen 1994 anni
2.938
-1.026
-25.89%
1 gen 1995 anni
2.325
-0.612
-20.85%
1 gen 1996 anni
3.647
+1.322
56.85%
1 gen 1997 anni
3.225
-0.421
-11.56%
1 gen 1998 anni
0.001
-3.225
-99.98%
1 gen 1999 anni
0.327
+0.326
62.38 Mille.%
1 gen 2000 anni
0.468
+0.142
43.35%
1 gen 2001 anni
0.646
+0.177
37.86%
1 gen 2002 anni
0.632
-0.014
-2.12%
1 gen 2003 anni
0.554
-0.078
-12.42%
1 gen 2004 anni
0.568
+0.014
2.53%
1 gen 2005 anni
0.536
-0.032
-5.63%
1 gen 2006 anni
0.614
+0.079
14.71%
1 gen 2007 anni
0.181
-0.434
-70.57%
1 gen 2008 anni
0.158
-0.023
-12.79%
1 gen 2009 anni
0.115
-0.043
-27.28%
1 gen 2010 anni
0.114
0.0
-0.18%
1 gen 2011 anni
0.118
+0.004
3.1%
1 gen 2012 anni
0.343
+0.225
190.45%
1 gen 2013 anni
0.14
-0.203
-59.1%
1 gen 2014 anni
0.123
-0.017
-12.38%
1 gen 2015 anni
0.182
+0.059
47.84%
Classificazione dei paesi secondo i statistiche attuali per anni


Commenti: