29
/it/
it
AIzaSyAYiBZKx7MnpbEhh9jyipgxe19OcubqV5w
April 1, 2024
123788
Ecuador
ECU
true
2
1
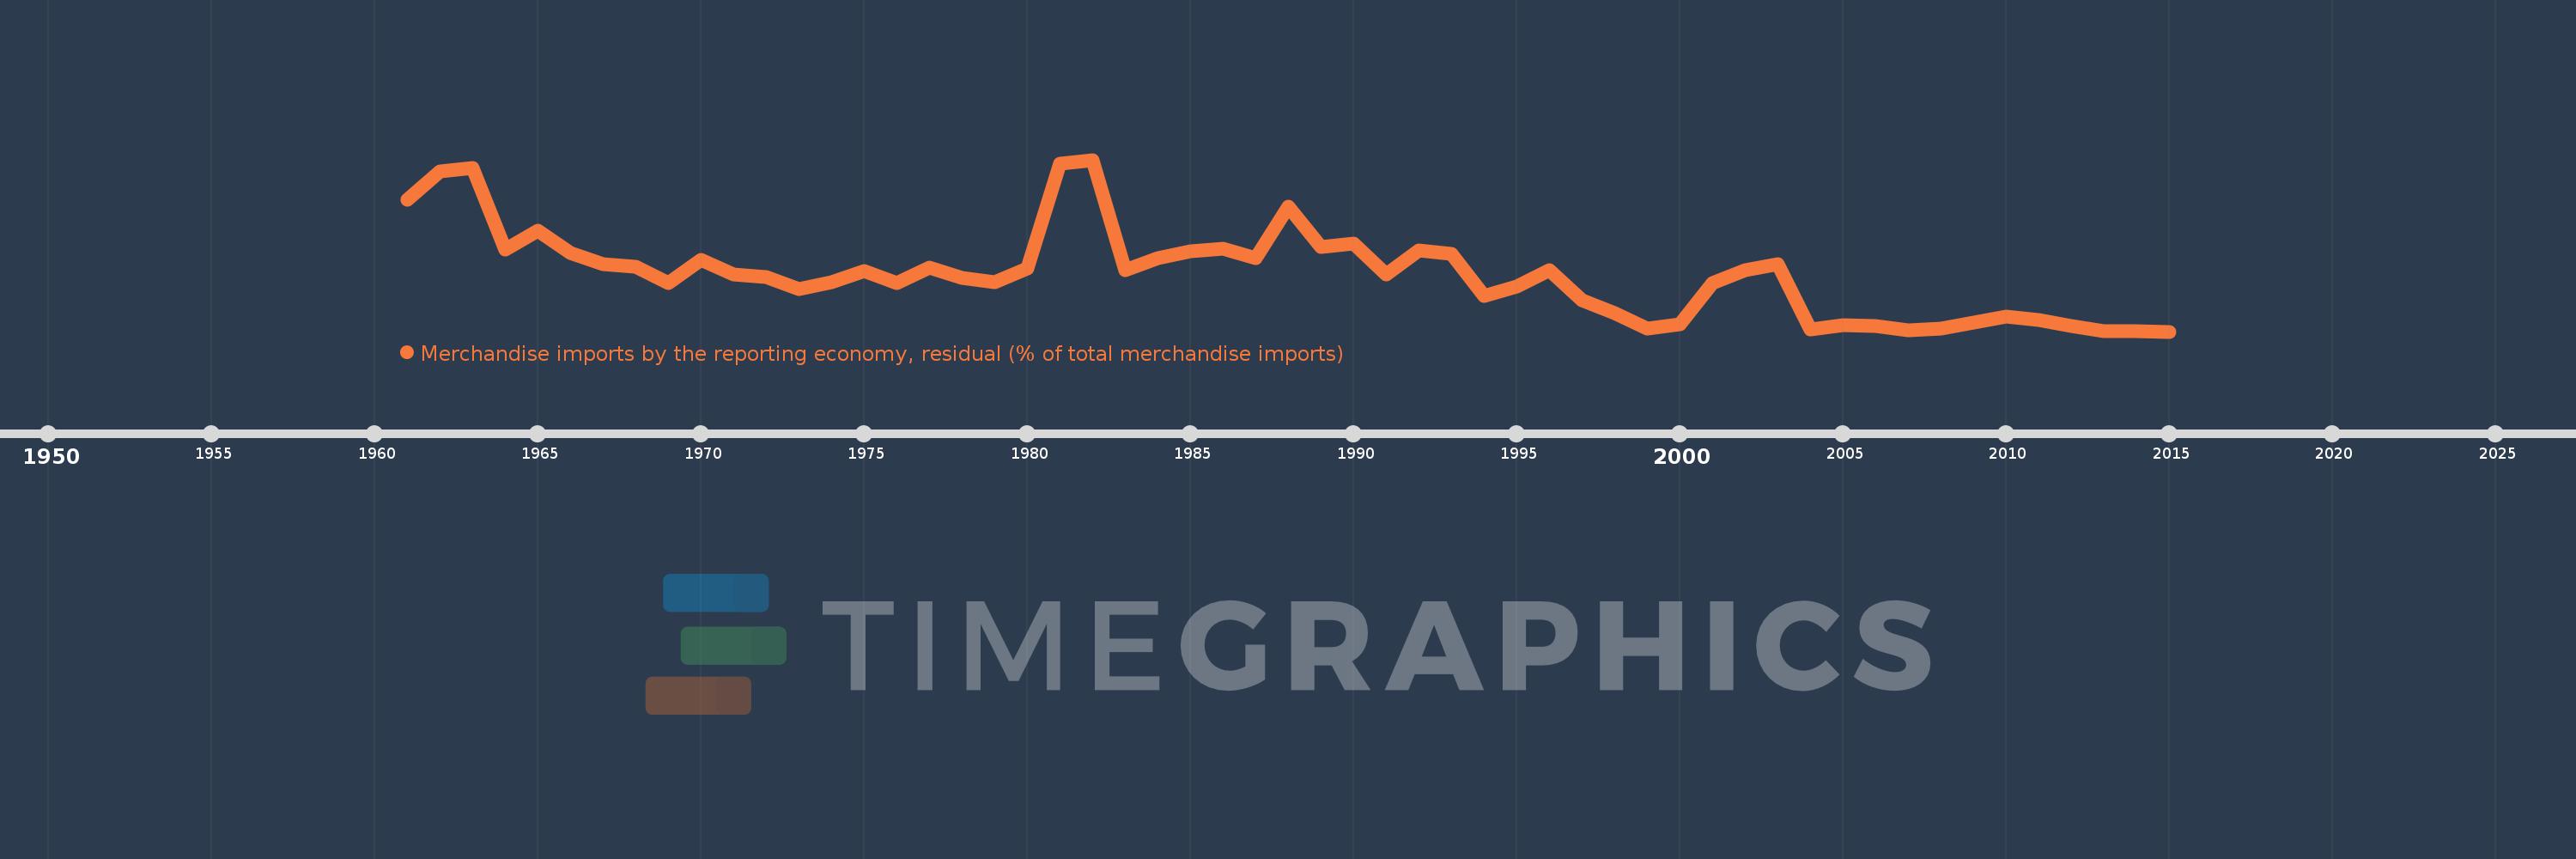
Merchandise imports by the reporting economy, residual (% of total merchandise imports)
2015,2014,2013,2012,2011,2010,2009,2008,2007,2006,2005,2004,2003,2002,2001,2000,1999,1998,1997,1996,1995,1994,1993,1992,1991,1990,1989,1988,1987,1986,1985,1984,1983,1982,1981,1980,1979,1978,1977,1976,1975,1974,1973,1972,1971,1970,1969,1968,1967,1966,1965,1964,1963,1962,1961
Queste statistiche in altri paesi:
AfghanistanAlbaniaAlgeriaAmerican SamoaAngolaAntigua and BarbudaArab WorldArgentinaArmeniaArubaAustraliaAustriaAzerbaijanBahamas, TheBahrainBangladeshBarbadosBelarusBelgiumBelizeBeninBermudaBoliviaBosnia and HerzegovinaBrazilBrunei DarussalamBulgariaBurkina FasoBurundiCabo VerdeCambodiaCameroonCanadaCaribbean small statesCentral African RepublicCentral Europe and the BalticsChadChileChinaColombiaComorosCongo, Dem. Rep.Congo, Rep.Costa RicaCote d'IvoireCroatiaCubaCyprusCzech RepublicDenmarkDjiboutiDominicaDominican RepublicEarly-demographic dividendEast Asia & PacificEast Asia & Pacific (excluding high income)East Asia & Pacific (IDA & IBRD countries)EcuadorEgypt, Arab Rep.El SalvadorEquatorial GuineaEstoniaEthiopiaEuro areaEurope & Central AsiaEurope & Central Asia (excluding high income)Europe & Central Asia (IDA & IBRD countries)European UnionFaroe IslandsFijiFinlandFragile and conflict affected situationsFranceFrench PolynesiaGabonGambia, TheGeorgiaGermanyGhanaGibraltarGreeceGreenlandGrenadaGuamGuatemalaGuineaGuinea-BissauGuyanaHaitiHeavily indebted poor countries (HIPC)High incomeHondurasHong Kong SAR, ChinaHungaryIBRD onlyIcelandIDA & IBRD totalIDA blendIDA onlyIDA totalIndiaIndonesiaIran, Islamic Rep.IraqIrelandIsraelItalyJamaicaJapanJordanKazakhstanKenyaKiribatiKorea, Dem. People’s Rep.Korea, Rep.KosovoKuwaitKyrgyz RepublicLao PDRLate-demographic dividendLatin America & Caribbean Latin America & Caribbean (excluding high income)Latin America & the Caribbean (IDA & IBRD countries)LatviaLeast developed countries: UN classificationLebanonLiberiaLibyaLithuaniaLow & middle incomeLow incomeLower middle incomeLuxembourgMacao SAR, ChinaMacedonia, FYRMadagascarMalawiMalaysiaMaldivesMaliMaltaMauritaniaMauritiusMexicoMiddle East & North AfricaMiddle East & North Africa (excluding high income)Middle East & North Africa (IDA & IBRD countries)Middle incomeMoldovaMongoliaMontenegroMoroccoMozambiqueMyanmarNauruNepalNetherlandsNew CaledoniaNew ZealandNicaraguaNigerNigeriaNorth AmericaNorwayOECD membersOmanOther small statesPacific island small statesPakistanPanamaPapua New GuineaParaguayPeruPhilippinesPolandPortugalPost-demographic dividendPre-demographic dividendQatarRomaniaRussian FederationRwandaSamoaSao Tome and PrincipeSaudi ArabiaSenegalSerbiaSeychellesSierra LeoneSingaporeSlovak RepublicSloveniaSmall statesSolomon IslandsSomaliaSouth AfricaSouth AsiaSouth Asia (IDA & IBRD)SpainSri LankaSt. Kitts and NevisSt. LuciaSt. Vincent and the GrenadinesSub-Saharan Africa Sub-Saharan Africa (excluding high income)Sub-Saharan Africa (IDA & IBRD countries)SudanSurinameSwedenSwitzerlandSyrian Arab RepublicTajikistanTanzaniaThailandTogoTongaTrinidad and TobagoTunisiaTurkeyTurkmenistanTuvaluUgandaUkraineUnited Arab EmiratesUnited KingdomUnited StatesUpper middle incomeUruguayUzbekistanVanuatuVenezuela, RBVietnamWorldYemen, Rep.ZambiaZimbabwe Linea del tempo:
Questa scala temporale mostra un grafico dal 1961 anno al 2015 anno. Ecuador. I dati fino ad 1960 anno non disponibili. Il numero di osservazioni attuali secondo i date: 55.
La fonte (nome):
Indicatori dello sviluppo mondiale
La fonte (organizzazione):
World Bank staff estimates based data from International Monetary Fund's Direction of Trade database.
Categorie:
Private Sector, Trade
sono stati aggiornati
23 apr 2017 anni
Indicatori delle variazioni dei valori per anni
Minima:
0.46
1 gen 2015 anni
Massimo:
12.236
1 gen 1982 anni
Alla data di osservazione
Valore
Variazione assoluta
La variazione rispetto al valore precedente
1 gen 1961 anni
9.505
+9.505
0.0%
1 gen 1962 anni
11.446
+1.941
20.42%
1 gen 1963 anni
11.653
+0.207
1.81%
1 gen 1964 anni
6.077
-5.575
-47.85%
1 gen 1965 anni
7.354
+1.277
21.01%
1 gen 1966 anni
5.876
-1.478
-20.09%
1 gen 1967 anni
5.065
-0.811
-13.8%
1 gen 1968 anni
4.878
-0.187
-3.7%
1 gen 1969 anni
3.809
-1.07
-21.93%
1 gen 1970 anni
5.393
+1.585
41.61%
1 gen 1971 anni
4.4
-0.993
-18.41%
1 gen 1972 anni
4.173
-0.227
-5.16%
1 gen 1973 anni
3.398
-0.775
-18.58%
1 gen 1974 anni
3.843
+0.445
13.1%
1 gen 1975 anni
4.607
+0.764
19.88%
1 gen 1976 anni
3.788
-0.82
-17.79%
1 gen 1977 anni
4.837
+1.049
27.69%
1 gen 1978 anni
4.158
-0.678
-14.03%
1 gen 1979 anni
3.857
-0.301
-7.23%
1 gen 1980 anni
4.792
+0.935
24.24%
1 gen 1981 anni
11.995
+7.203
150.3%
1 gen 1982 anni
12.236
+0.241
2.01%
1 gen 1983 anni
4.662
-7.574
-61.9%
1 gen 1984 anni
5.517
+0.855
18.33%
1 gen 1985 anni
5.989
+0.473
8.57%
1 gen 1986 anni
6.151
+0.162
2.7%
1 gen 1987 anni
5.509
-0.642
-10.43%
1 gen 1988 anni
8.999
+3.49
63.35%
1 gen 1989 anni
6.282
-2.718
-30.2%
1 gen 1990 anni
6.475
+0.193
3.07%
1 gen 1991 anni
4.377
-2.098
-32.4%
1 gen 1992 anni
6.02
+1.643
37.55%
1 gen 1993 anni
5.811
-0.21
-3.48%
1 gen 1994 anni
2.922
-2.888
-49.71%
1 gen 1995 anni
3.573
+0.651
22.26%
1 gen 1996 anni
4.668
+1.095
30.64%
1 gen 1997 anni
2.621
-2.046
-43.84%
1 gen 1998 anni
1.711
-0.91
-34.73%
1 gen 1999 anni
0.641
-1.07
-62.56%
1 gen 2000 anni
0.988
+0.347
54.23%
1 gen 2001 anni
3.769
+2.781
281.48%
1 gen 2002 anni
4.653
+0.883
23.44%
1 gen 2003 anni
5.095
+0.443
9.52%
1 gen 2004 anni
0.589
-4.506
-88.43%
1 gen 2005 anni
0.903
+0.313
53.19%
1 gen 2006 anni
0.848
-0.055
-6.1%
1 gen 2007 anni
0.54
-0.308
-36.32%
1 gen 2008 anni
0.644
+0.104
19.25%
1 gen 2009 anni
1.102
+0.459
71.26%
1 gen 2010 anni
1.483
+0.381
34.55%
1 gen 2011 anni
1.241
-0.242
-16.33%
1 gen 2012 anni
0.871
-0.37
-29.82%
1 gen 2013 anni
0.495
-0.376
-43.19%
1 gen 2014 anni
0.512
+0.017
3.38%
1 gen 2015 anni
0.46
-0.051
-10.02%
Classificazione dei paesi secondo i statistiche attuali per anni


Commenti: