29
/it/
it
AIzaSyAYiBZKx7MnpbEhh9jyipgxe19OcubqV5w
April 1, 2024
194520
Mauritius
MUS
true
2
1
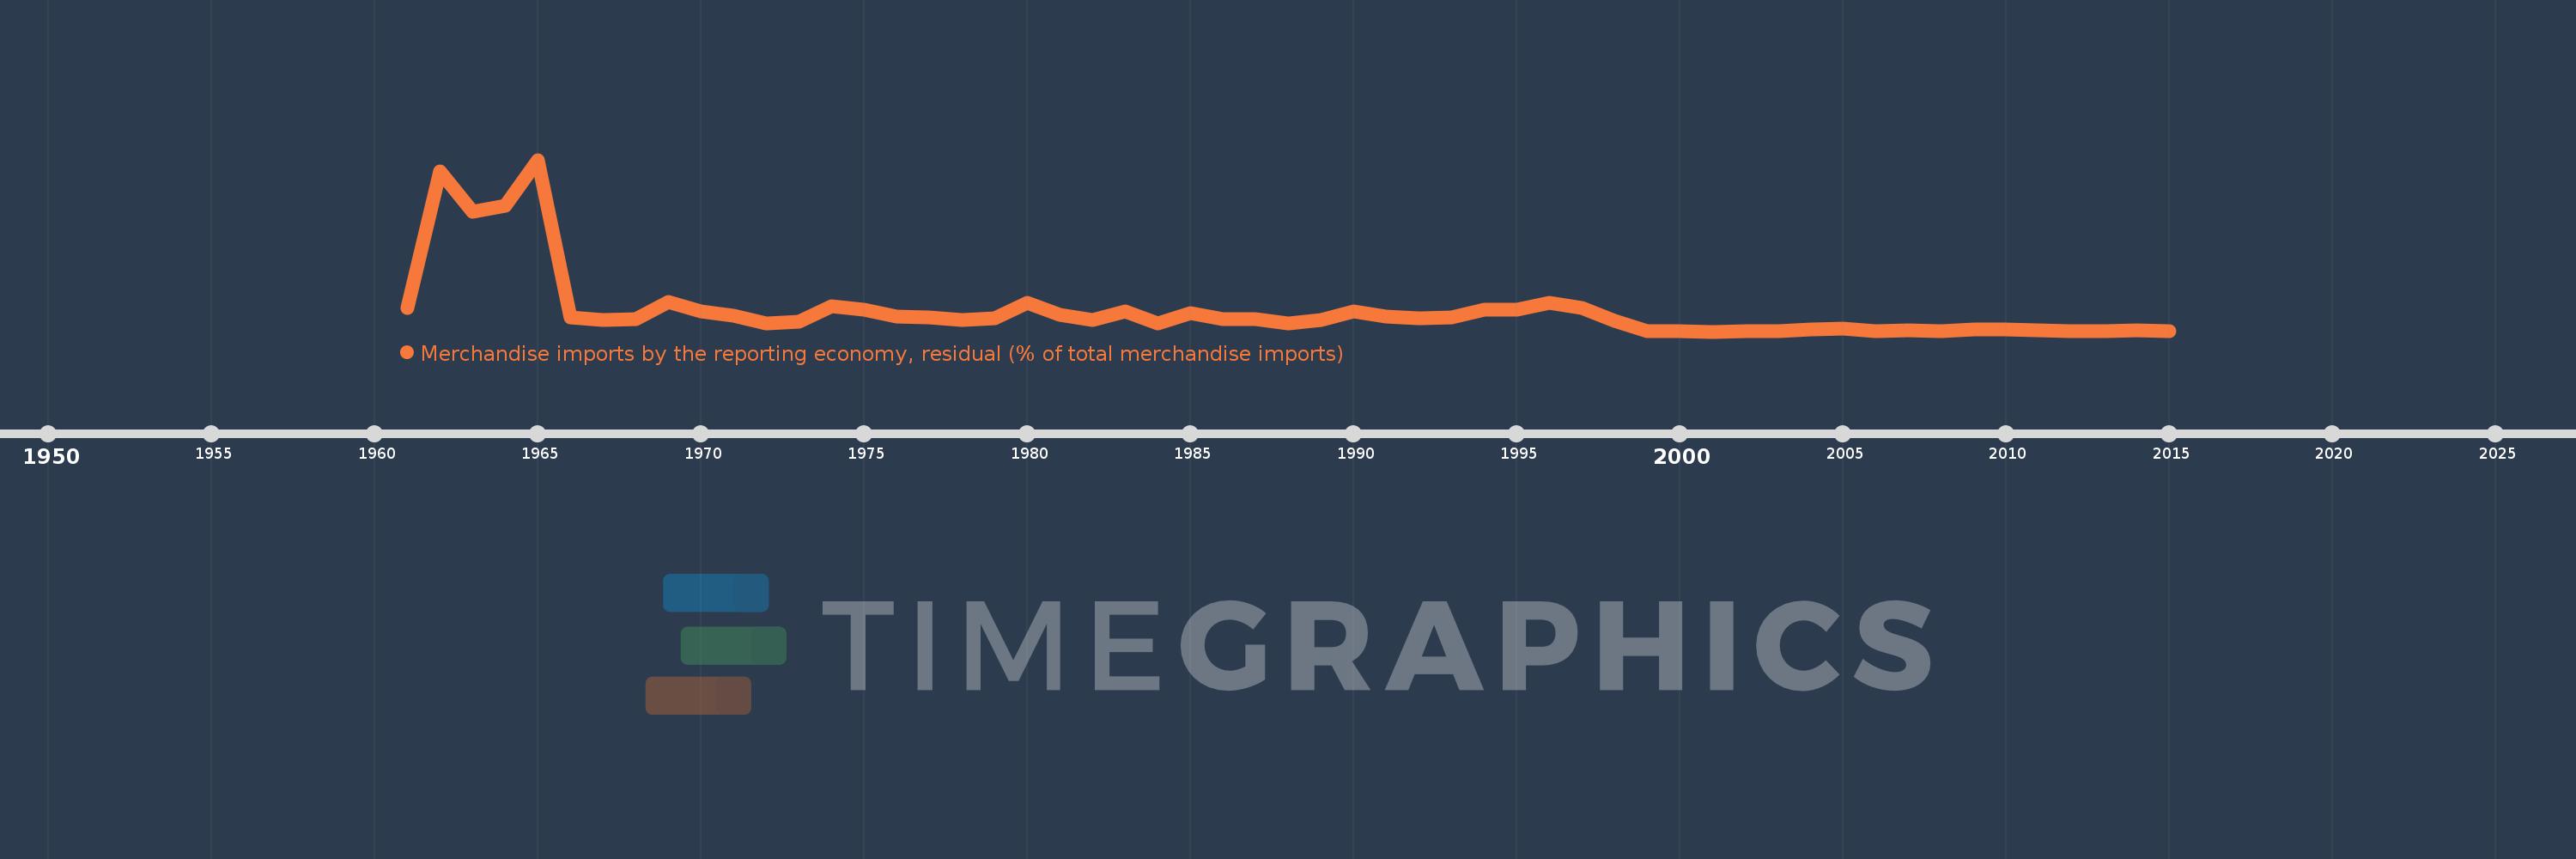
Merchandise imports by the reporting economy, residual (% of total merchandise imports)
2015,2014,2013,2012,2011,2010,2009,2008,2007,2006,2005,2004,2003,2002,2001,2000,1999,1998,1997,1996,1995,1994,1993,1992,1991,1990,1989,1988,1987,1986,1985,1984,1983,1982,1981,1980,1979,1978,1977,1976,1975,1974,1973,1972,1971,1970,1969,1968,1967,1966,1965,1964,1963,1962,1961
Queste statistiche in altri paesi:
AfghanistanAlbaniaAlgeriaAmerican SamoaAngolaAntigua and BarbudaArab WorldArgentinaArmeniaArubaAustraliaAustriaAzerbaijanBahamas, TheBahrainBangladeshBarbadosBelarusBelgiumBelizeBeninBermudaBoliviaBosnia and HerzegovinaBrazilBrunei DarussalamBulgariaBurkina FasoBurundiCabo VerdeCambodiaCameroonCanadaCaribbean small statesCentral African RepublicCentral Europe and the BalticsChadChileChinaColombiaComorosCongo, Dem. Rep.Congo, Rep.Costa RicaCote d'IvoireCroatiaCubaCyprusCzech RepublicDenmarkDjiboutiDominicaDominican RepublicEarly-demographic dividendEast Asia & PacificEast Asia & Pacific (excluding high income)East Asia & Pacific (IDA & IBRD countries)EcuadorEgypt, Arab Rep.El SalvadorEquatorial GuineaEstoniaEthiopiaEuro areaEurope & Central AsiaEurope & Central Asia (excluding high income)Europe & Central Asia (IDA & IBRD countries)European UnionFaroe IslandsFijiFinlandFragile and conflict affected situationsFranceFrench PolynesiaGabonGambia, TheGeorgiaGermanyGhanaGibraltarGreeceGreenlandGrenadaGuamGuatemalaGuineaGuinea-BissauGuyanaHaitiHeavily indebted poor countries (HIPC)High incomeHondurasHong Kong SAR, ChinaHungaryIBRD onlyIcelandIDA & IBRD totalIDA blendIDA onlyIDA totalIndiaIndonesiaIran, Islamic Rep.IraqIrelandIsraelItalyJamaicaJapanJordanKazakhstanKenyaKiribatiKorea, Dem. People’s Rep.Korea, Rep.KosovoKuwaitKyrgyz RepublicLao PDRLate-demographic dividendLatin America & Caribbean Latin America & Caribbean (excluding high income)Latin America & the Caribbean (IDA & IBRD countries)LatviaLeast developed countries: UN classificationLebanonLiberiaLibyaLithuaniaLow & middle incomeLow incomeLower middle incomeLuxembourgMacao SAR, ChinaMacedonia, FYRMadagascarMalawiMalaysiaMaldivesMaliMaltaMauritaniaMauritiusMexicoMiddle East & North AfricaMiddle East & North Africa (excluding high income)Middle East & North Africa (IDA & IBRD countries)Middle incomeMoldovaMongoliaMontenegroMoroccoMozambiqueMyanmarNauruNepalNetherlandsNew CaledoniaNew ZealandNicaraguaNigerNigeriaNorth AmericaNorwayOECD membersOmanOther small statesPacific island small statesPakistanPanamaPapua New GuineaParaguayPeruPhilippinesPolandPortugalPost-demographic dividendPre-demographic dividendQatarRomaniaRussian FederationRwandaSamoaSao Tome and PrincipeSaudi ArabiaSenegalSerbiaSeychellesSierra LeoneSingaporeSlovak RepublicSloveniaSmall statesSolomon IslandsSomaliaSouth AfricaSouth AsiaSouth Asia (IDA & IBRD)SpainSri LankaSt. Kitts and NevisSt. LuciaSt. Vincent and the GrenadinesSub-Saharan Africa Sub-Saharan Africa (excluding high income)Sub-Saharan Africa (IDA & IBRD countries)SudanSurinameSwedenSwitzerlandSyrian Arab RepublicTajikistanTanzaniaThailandTogoTongaTrinidad and TobagoTunisiaTurkeyTurkmenistanTuvaluUgandaUkraineUnited Arab EmiratesUnited KingdomUnited StatesUpper middle incomeUruguayUzbekistanVanuatuVenezuela, RBVietnamWorldYemen, Rep.ZambiaZimbabwe Linea del tempo:
Questa scala temporale mostra un grafico dal 1961 anno al 2015 anno. Mauritius. I dati fino ad 1960 anno non disponibili. Il numero di osservazioni attuali secondo i date: 55.
La fonte (nome):
Indicatori dello sviluppo mondiale
La fonte (organizzazione):
World Bank staff estimates based data from International Monetary Fund's Direction of Trade database.
Categorie:
Private Sector, Trade
sono stati aggiornati
23 apr 2017 anni
Indicatori delle variazioni dei valori per anni
Minima:
0.001
1 gen 2001 anni
Massimo:
25.439
1 gen 1965 anni
Alla data di osservazione
Valore
Variazione assoluta
La variazione rispetto al valore precedente
1 gen 1961 anni
3.509
+3.509
0.0%
1 gen 1962 anni
23.672
+20.163
574.66%
1 gen 1963 anni
17.764
-5.908
-24.96%
1 gen 1964 anni
18.649
+0.885
4.98%
1 gen 1965 anni
25.439
+6.79
36.41%
1 gen 1966 anni
2.133
-23.305
-91.61%
1 gen 1967 anni
1.742
-0.392
-18.36%
1 gen 1968 anni
1.854
+0.113
6.47%
1 gen 1969 anni
4.416
+2.562
138.15%
1 gen 1970 anni
2.995
-1.421
-32.17%
1 gen 1971 anni
2.408
-0.587
-19.61%
1 gen 1972 anni
1.175
-1.233
-51.2%
1 gen 1973 anni
1.433
+0.258
21.97%
1 gen 1974 anni
3.749
+2.316
161.63%
1 gen 1975 anni
3.196
-0.554
-14.77%
1 gen 1976 anni
2.18
-1.015
-31.77%
1 gen 1977 anni
2.101
-0.079
-3.64%
1 gen 1978 anni
1.688
-0.413
-19.65%
1 gen 1979 anni
1.944
+0.256
15.14%
1 gen 1980 anni
4.318
+2.374
122.13%
1 gen 1981 anni
2.486
-1.832
-42.42%
1 gen 1982 anni
1.765
-0.721
-29.0%
1 gen 1983 anni
2.965
+1.2
67.96%
1 gen 1984 anni
1.162
-1.802
-60.8%
1 gen 1985 anni
2.748
+1.586
136.42%
1 gen 1986 anni
1.843
-0.905
-32.95%
1 gen 1987 anni
1.799
-0.044
-2.38%
1 gen 1988 anni
1.213
-0.586
-32.56%
1 gen 1989 anni
1.749
+0.536
44.15%
1 gen 1990 anni
3.042
+1.293
73.97%
1 gen 1991 anni
2.288
-0.754
-24.79%
1 gen 1992 anni
2.019
-0.269
-11.76%
1 gen 1993 anni
2.101
+0.082
4.07%
1 gen 1994 anni
3.213
+1.112
52.94%
1 gen 1995 anni
3.293
+0.08
2.48%
1 gen 1996 anni
4.29
+0.997
30.26%
1 gen 1997 anni
3.54
-0.749
-17.47%
1 gen 1998 anni
1.628
-1.912
-54.01%
1 gen 1999 anni
0.11
-1.518
-93.24%
1 gen 2000 anni
0.028
-0.082
-74.33%
1 gen 2001 anni
0.001
-0.027
-94.77%
1 gen 2002 anni
0.024
+0.022
1.52 Mille.%
1 gen 2003 anni
0.002
-0.022
-90.89%
1 gen 2004 anni
0.355
+0.353
16.16 Mille.%
1 gen 2005 anni
0.401
+0.046
12.98%
1 gen 2006 anni
0.127
-0.274
-68.29%
1 gen 2007 anni
0.169
+0.041
32.62%
1 gen 2008 anni
0.014
-0.154
-91.48%
1 gen 2009 anni
0.301
+0.287
2.0 Mille.%
1 gen 2010 anni
0.36
+0.059
19.51%
1 gen 2011 anni
0.155
-0.205
-57.0%
1 gen 2012 anni
0.015
-0.139
-90.11%
1 gen 2013 anni
0.015
-0.001
-4.3%
1 gen 2014 anni
0.152
+0.137
938.84%
1 gen 2015 anni
0.031
-0.121
-79.37%
Classificazione dei paesi secondo i statistiche attuali per anni


Commenti: