29
/it/
it
AIzaSyAYiBZKx7MnpbEhh9jyipgxe19OcubqV5w
April 1, 2024
40900
Late-demographic dividend
LTE
false
2
1
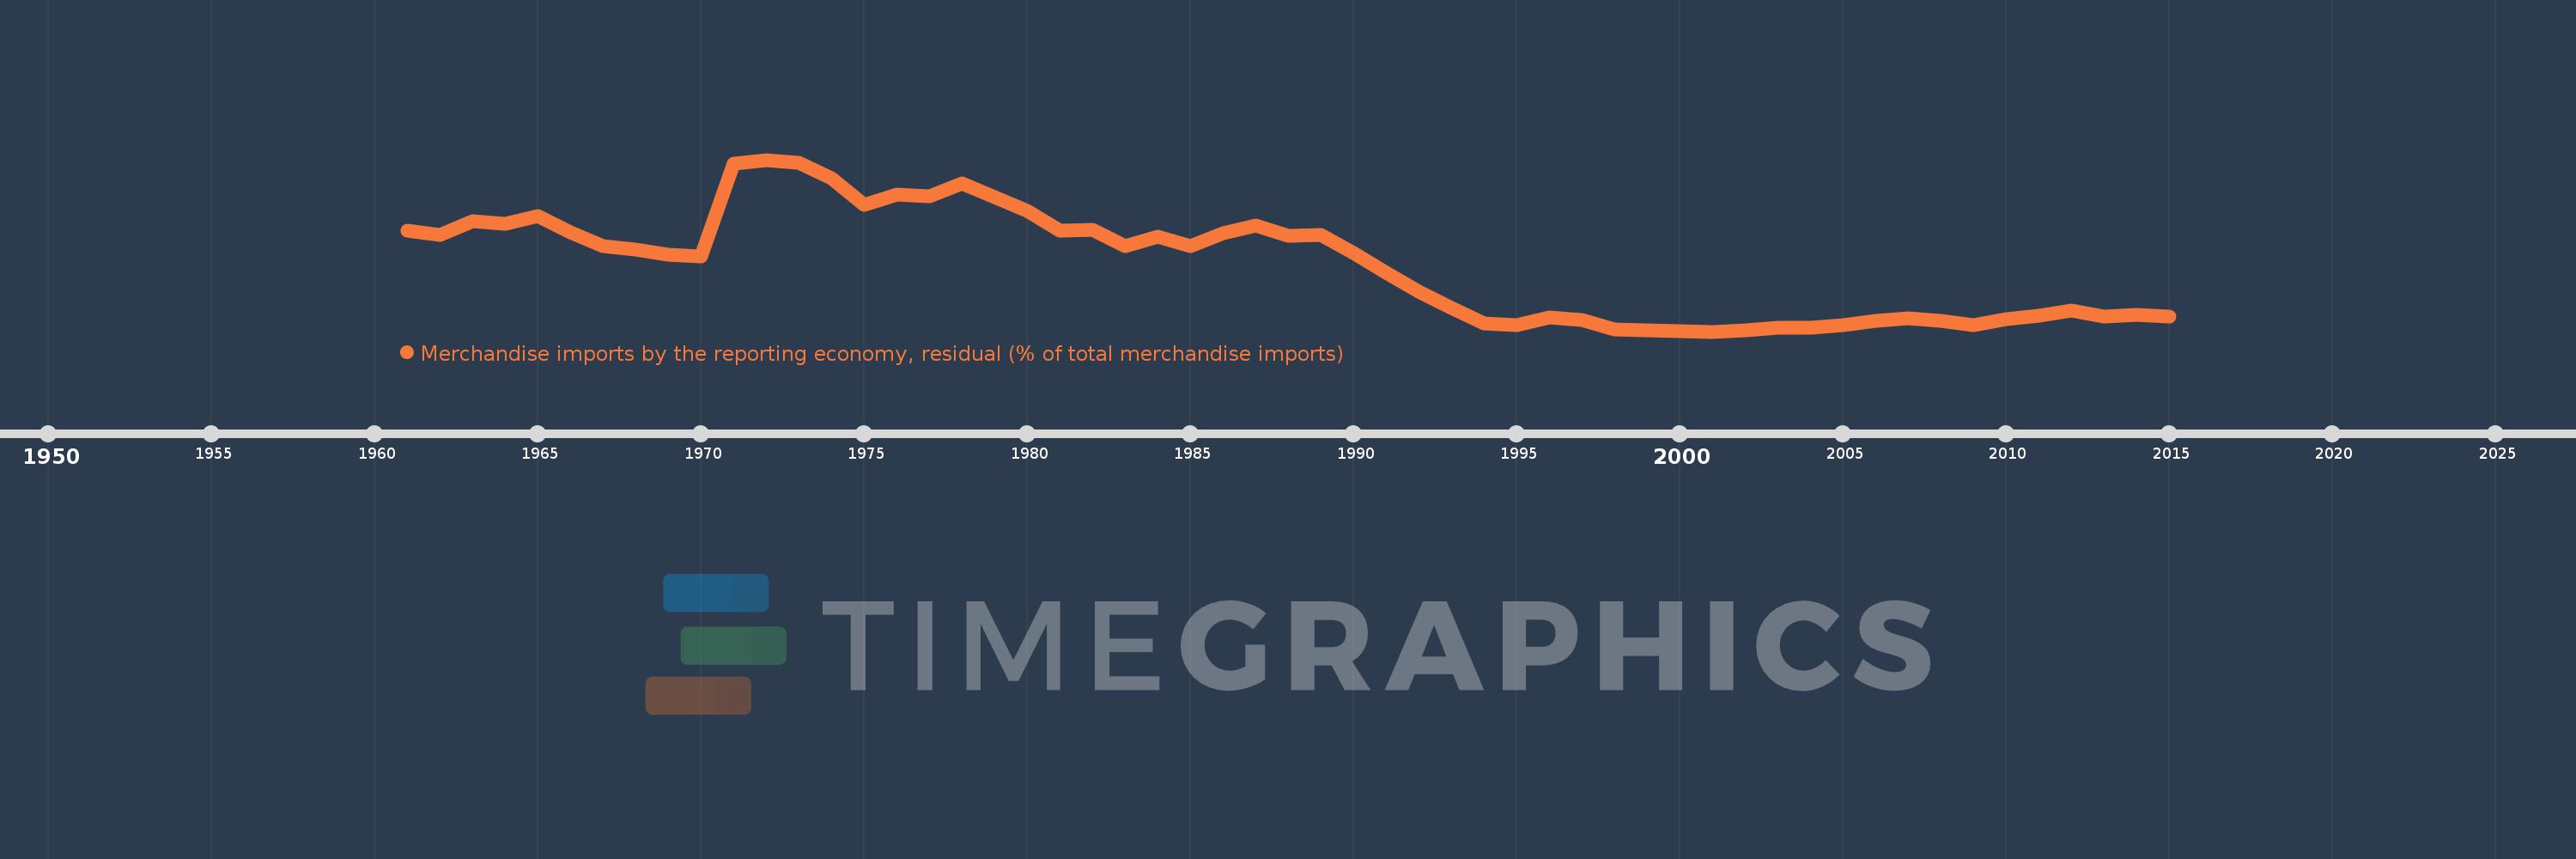
Merchandise imports by the reporting economy, residual (% of total merchandise imports)
2015,2014,2013,2012,2011,2010,2009,2008,2007,2006,2005,2004,2003,2002,2001,2000,1999,1998,1997,1996,1995,1994,1993,1992,1991,1990,1989,1988,1987,1986,1985,1984,1983,1982,1981,1980,1979,1978,1977,1976,1975,1974,1973,1972,1971,1970,1969,1968,1967,1966,1965,1964,1963,1962,1961
Queste statistiche in altri paesi:
AfghanistanAlbaniaAlgeriaAmerican SamoaAngolaAntigua and BarbudaArab WorldArgentinaArmeniaArubaAustraliaAustriaAzerbaijanBahamas, TheBahrainBangladeshBarbadosBelarusBelgiumBelizeBeninBermudaBoliviaBosnia and HerzegovinaBrazilBrunei DarussalamBulgariaBurkina FasoBurundiCabo VerdeCambodiaCameroonCanadaCaribbean small statesCentral African RepublicCentral Europe and the BalticsChadChileChinaColombiaComorosCongo, Dem. Rep.Congo, Rep.Costa RicaCote d'IvoireCroatiaCubaCyprusCzech RepublicDenmarkDjiboutiDominicaDominican RepublicEarly-demographic dividendEast Asia & PacificEast Asia & Pacific (excluding high income)East Asia & Pacific (IDA & IBRD countries)EcuadorEgypt, Arab Rep.El SalvadorEquatorial GuineaEstoniaEthiopiaEuro areaEurope & Central AsiaEurope & Central Asia (excluding high income)Europe & Central Asia (IDA & IBRD countries)European UnionFaroe IslandsFijiFinlandFragile and conflict affected situationsFranceFrench PolynesiaGabonGambia, TheGeorgiaGermanyGhanaGibraltarGreeceGreenlandGrenadaGuamGuatemalaGuineaGuinea-BissauGuyanaHaitiHeavily indebted poor countries (HIPC)High incomeHondurasHong Kong SAR, ChinaHungaryIBRD onlyIcelandIDA & IBRD totalIDA blendIDA onlyIDA totalIndiaIndonesiaIran, Islamic Rep.IraqIrelandIsraelItalyJamaicaJapanJordanKazakhstanKenyaKiribatiKorea, Dem. People’s Rep.Korea, Rep.KosovoKuwaitKyrgyz RepublicLao PDRLate-demographic dividendLatin America & Caribbean Latin America & Caribbean (excluding high income)Latin America & the Caribbean (IDA & IBRD countries)LatviaLeast developed countries: UN classificationLebanonLiberiaLibyaLithuaniaLow & middle incomeLow incomeLower middle incomeLuxembourgMacao SAR, ChinaMacedonia, FYRMadagascarMalawiMalaysiaMaldivesMaliMaltaMauritaniaMauritiusMexicoMiddle East & North AfricaMiddle East & North Africa (excluding high income)Middle East & North Africa (IDA & IBRD countries)Middle incomeMoldovaMongoliaMontenegroMoroccoMozambiqueMyanmarNauruNepalNetherlandsNew CaledoniaNew ZealandNicaraguaNigerNigeriaNorth AmericaNorwayOECD membersOmanOther small statesPacific island small statesPakistanPanamaPapua New GuineaParaguayPeruPhilippinesPolandPortugalPost-demographic dividendPre-demographic dividendQatarRomaniaRussian FederationRwandaSamoaSao Tome and PrincipeSaudi ArabiaSenegalSerbiaSeychellesSierra LeoneSingaporeSlovak RepublicSloveniaSmall statesSolomon IslandsSomaliaSouth AfricaSouth AsiaSouth Asia (IDA & IBRD)SpainSri LankaSt. Kitts and NevisSt. LuciaSt. Vincent and the GrenadinesSub-Saharan Africa Sub-Saharan Africa (excluding high income)Sub-Saharan Africa (IDA & IBRD countries)SudanSurinameSwedenSwitzerlandSyrian Arab RepublicTajikistanTanzaniaThailandTogoTongaTrinidad and TobagoTunisiaTurkeyTurkmenistanTuvaluUgandaUkraineUnited Arab EmiratesUnited KingdomUnited StatesUpper middle incomeUruguayUzbekistanVanuatuVenezuela, RBVietnamWorldYemen, Rep.ZambiaZimbabwe Linea del tempo:
Questa scala temporale mostra un grafico dal 1961 anno al 2015 anno. Late-demographic dividend. I dati fino ad 1960 anno non disponibili. Il numero di osservazioni attuali secondo i date: 55.
La fonte (nome):
Indicatori dello sviluppo mondiale
La fonte (organizzazione):
World Bank staff estimates based data from International Monetary Fund's Direction of Trade database.
Categorie:
Private Sector, Trade
sono stati aggiornati
23 apr 2017 anni
Indicatori delle variazioni dei valori per anni
Minima:
2.725
1 gen 2001 anni
Massimo:
21.326
1 gen 1972 anni
Alla data di osservazione
Valore
Variazione assoluta
La variazione rispetto al valore precedente
1 gen 1961 anni
13.66
+13.66
0.0%
1 gen 1962 anni
13.148
-0.512
-3.75%
1 gen 1963 anni
14.658
+1.51
11.49%
1 gen 1964 anni
14.419
-0.24
-1.64%
1 gen 1965 anni
15.242
+0.823
5.71%
1 gen 1966 anni
13.491
-1.75
-11.48%
1 gen 1967 anni
11.996
-1.496
-11.09%
1 gen 1968 anni
11.609
-0.387
-3.22%
1 gen 1969 anni
11.078
-0.531
-4.57%
1 gen 1970 anni
10.88
-0.198
-1.79%
1 gen 1971 anni
20.891
+10.011
92.01%
1 gen 1972 anni
21.326
+0.435
2.08%
1 gen 1973 anni
20.985
-0.341
-1.6%
1 gen 1974 anni
19.298
-1.687
-8.04%
1 gen 1975 anni
16.427
-2.871
-14.88%
1 gen 1976 anni
17.562
+1.135
6.91%
1 gen 1977 anni
17.408
-0.154
-0.88%
1 gen 1978 anni
18.813
+1.405
8.07%
1 gen 1979 anni
17.248
-1.565
-8.32%
1 gen 1980 anni
15.823
-1.424
-8.26%
1 gen 1981 anni
13.664
-2.16
-13.65%
1 gen 1982 anni
13.774
+0.11
0.8%
1 gen 1983 anni
12.021
-1.753
-12.73%
1 gen 1984 anni
12.974
+0.953
7.93%
1 gen 1985 anni
11.987
-0.987
-7.61%
1 gen 1986 anni
13.395
+1.407
11.74%
1 gen 1987 anni
14.225
+0.831
6.2%
1 gen 1988 anni
13.06
-1.165
-8.19%
1 gen 1989 anni
13.167
+0.108
0.82%
1 gen 1990 anni
11.28
-1.887
-14.33%
1 gen 1991 anni
9.077
-2.203
-19.53%
1 gen 1992 anni
7.085
-1.992
-21.94%
1 gen 1993 anni
5.325
-1.76
-24.84%
1 gen 1994 anni
3.634
-1.691
-31.75%
1 gen 1995 anni
3.418
-0.217
-5.96%
1 gen 1996 anni
4.261
+0.843
24.67%
1 gen 1997 anni
3.98
-0.281
-6.59%
1 gen 1998 anni
2.967
-1.013
-25.46%
1 gen 1999 anni
2.881
-0.086
-2.9%
1 gen 2000 anni
2.787
-0.093
-3.24%
1 gen 2001 anni
2.725
-0.062
-2.23%
1 gen 2002 anni
2.901
+0.175
6.44%
1 gen 2003 anni
3.144
+0.243
8.38%
1 gen 2004 anni
3.134
-0.01
-0.33%
1 gen 2005 anni
3.445
+0.311
9.93%
1 gen 2006 anni
3.865
+0.42
12.19%
1 gen 2007 anni
4.199
+0.334
8.64%
1 gen 2008 anni
3.932
-0.267
-6.35%
1 gen 2009 anni
3.427
-0.505
-12.84%
1 gen 2010 anni
4.114
+0.687
20.04%
1 gen 2011 anni
4.486
+0.372
9.03%
1 gen 2012 anni
4.975
+0.489
10.91%
1 gen 2013 anni
4.347
-0.628
-12.62%
1 gen 2014 anni
4.533
+0.186
4.28%
1 gen 2015 anni
4.323
-0.211
-4.65%
Classificazione dei paesi secondo i statistiche attuali per anni


Commenti: