29
/it/
it
AIzaSyAYiBZKx7MnpbEhh9jyipgxe19OcubqV5w
April 1, 2024
38810
IDA only
IDX
false
2
1
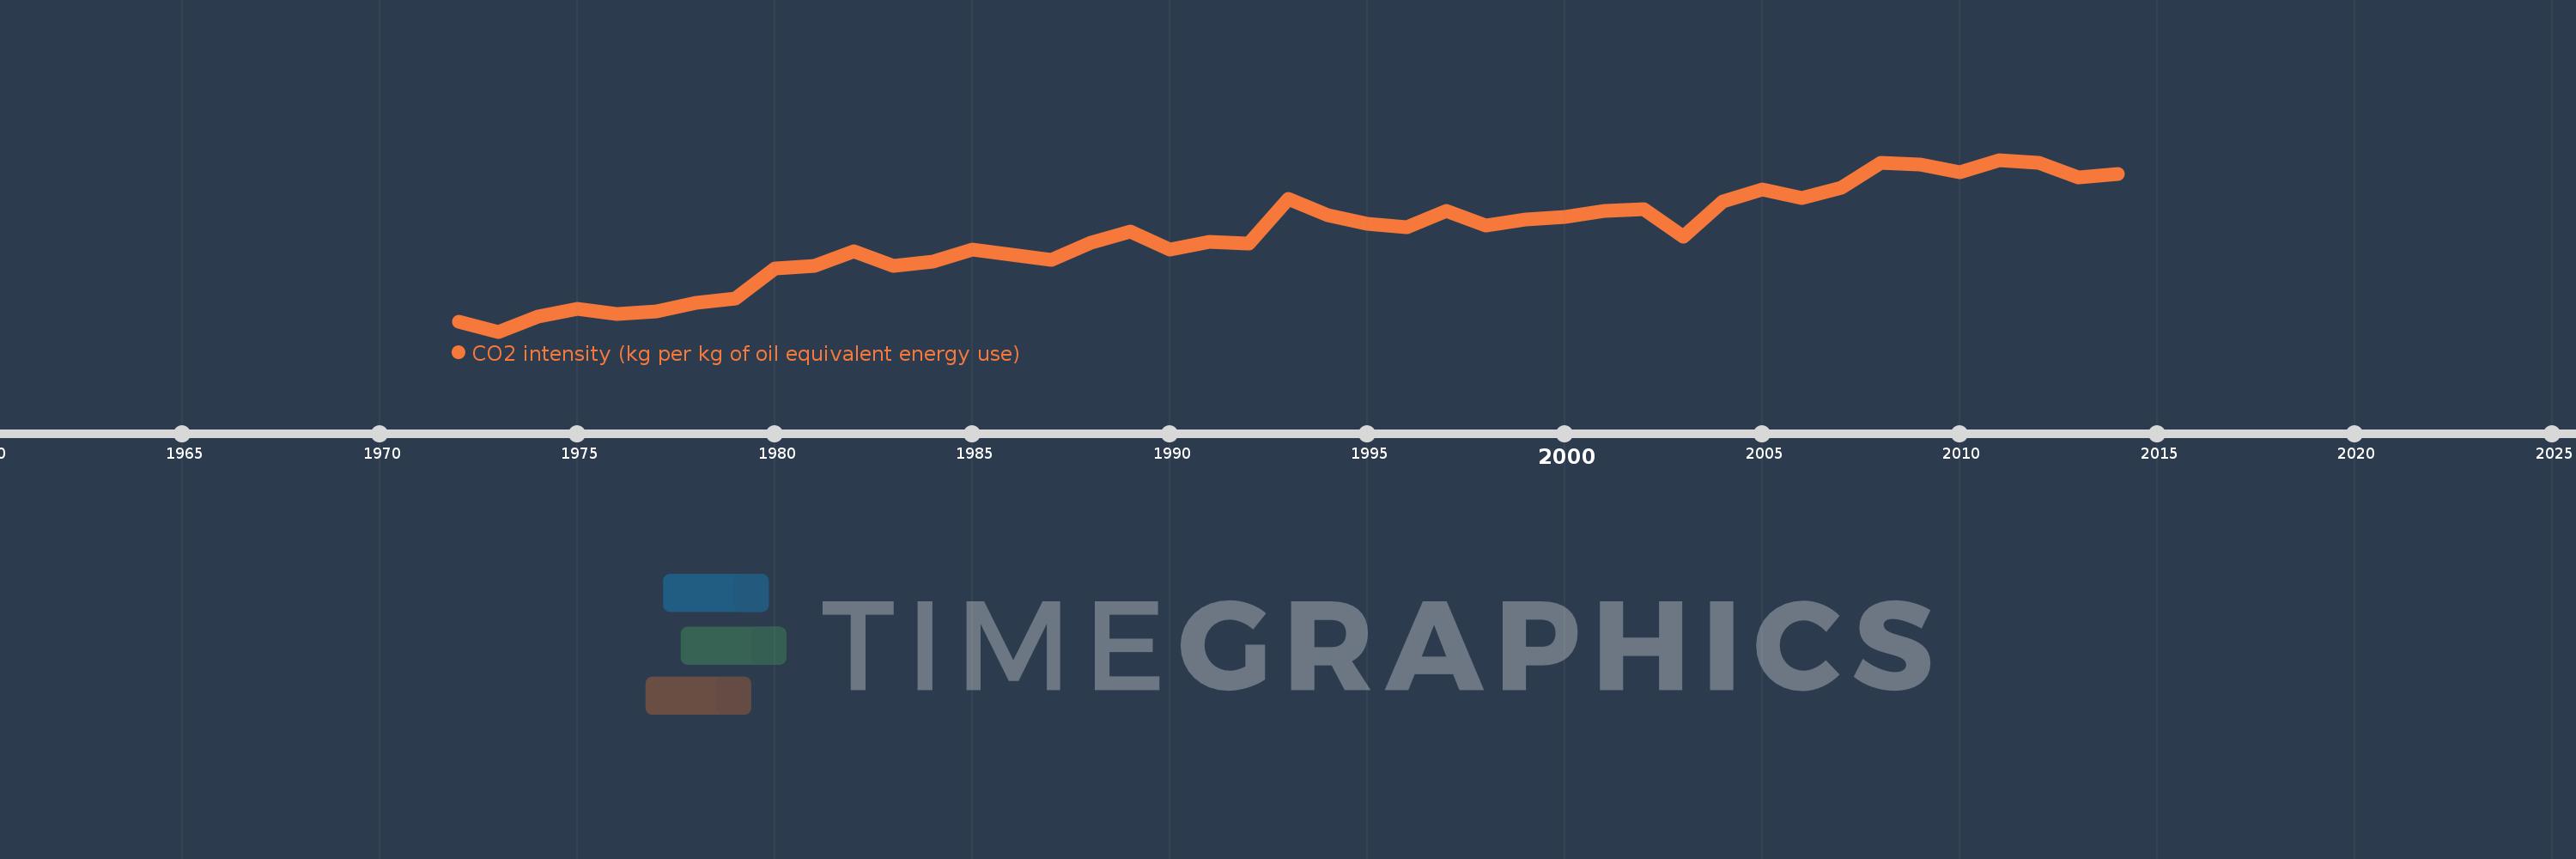
CO2 intensity (kg per kg of oil equivalent energy use)
2014,2013,2012,2011,2010,2009,2008,2007,2006,2005,2004,2003,2002,2001,2000,1999,1998,1997,1996,1995,1994,1993,1992,1991,1990,1989,1988,1987,1986,1985,1984,1983,1982,1981,1980,1979,1978,1977,1976,1975,1974,1973,1972
Queste statistiche in altri paesi:
AlbaniaAlgeriaAngolaAntigua and BarbudaArab WorldArgentinaArmeniaAustraliaAustriaAzerbaijanBahamas, TheBahrainBangladeshBarbadosBelarusBelgiumBelizeBeninBhutanBoliviaBosnia and HerzegovinaBotswanaBrazilBrunei DarussalamBulgariaCabo VerdeCambodiaCameroonCanadaCaribbean small statesCentral Europe and the BalticsChileChinaColombiaComorosCongo, Dem. Rep.Congo, Rep.Costa RicaCote d'IvoireCroatiaCubaCuracaoCyprusCzech RepublicDenmarkDjiboutiDominicaDominican RepublicEarly-demographic dividendEast Asia & PacificEast Asia & Pacific (excluding high income)East Asia & Pacific (IDA & IBRD countries)EcuadorEgypt, Arab Rep.El SalvadorEquatorial GuineaEritreaEstoniaEthiopiaEuro areaEurope & Central AsiaEurope & Central Asia (excluding high income)Europe & Central Asia (IDA & IBRD countries)European UnionFijiFinlandFragile and conflict affected situationsFranceGabonGambia, TheGeorgiaGermanyGhanaGibraltarGreeceGrenadaGuatemalaGuinea-BissauGuyanaHaitiHeavily indebted poor countries (HIPC)High incomeHondurasHong Kong SAR, ChinaHungaryIBRD onlyIcelandIDA & IBRD totalIDA blendIDA onlyIDA totalIndiaIndonesiaIran, Islamic Rep.IraqIrelandIsraelItalyJamaicaJapanJordanKazakhstanKenyaKiribatiKorea, Dem. People’s Rep.Korea, Rep.KuwaitKyrgyz RepublicLate-demographic dividendLatin America & Caribbean Latin America & Caribbean (excluding high income)Latin America & the Caribbean (IDA & IBRD countries)LatviaLeast developed countries: UN classificationLebanonLesothoLibyaLithuaniaLow & middle incomeLow incomeLower middle incomeLuxembourgMacedonia, FYRMalaysiaMaldivesMaltaMarshall IslandsMauritiusMexicoMiddle East & North AfricaMiddle East & North Africa (excluding high income)Middle East & North Africa (IDA & IBRD countries)Middle incomeMoldovaMongoliaMontenegroMoroccoMozambiqueMyanmarNamibiaNepalNetherlandsNew ZealandNicaraguaNigerNigeriaNorth AmericaNorwayOECD membersOmanOther small statesPacific island small statesPakistanPalauPanamaParaguayPeruPhilippinesPolandPortugalPost-demographic dividendPre-demographic dividendQatarRomaniaRussian FederationSamoaSao Tome and PrincipeSaudi ArabiaSenegalSerbiaSeychellesSingaporeSlovak RepublicSloveniaSmall statesSolomon IslandsSouth AfricaSouth AsiaSouth Asia (IDA & IBRD)South SudanSpainSri LankaSt. Kitts and NevisSt. LuciaSt. Vincent and the GrenadinesSub-Saharan Africa Sub-Saharan Africa (excluding high income)Sub-Saharan Africa (IDA & IBRD countries)SudanSurinameSwazilandSwedenSwitzerlandSyrian Arab RepublicTajikistanTanzaniaThailandTimor-LesteTogoTongaTrinidad and TobagoTunisiaTurkeyTurkmenistanUkraineUnited Arab EmiratesUnited KingdomUnited StatesUpper middle incomeUruguayUzbekistanVanuatuVenezuela, RBVietnamWorldYemen, Rep.ZambiaZimbabwe Linea del tempo:
Questa scala temporale mostra un grafico dal 1972 anno al 2014 anno. IDA only. I dati fino ad 1971 anno non disponibili. Il numero di osservazioni attuali secondo i date: 43.
La fonte (nome):
Indicatori dello sviluppo mondiale
La fonte (organizzazione):
Carbon Dioxide Information Analysis Center, Environmental Sciences Division, Oak Ridge National Laboratory, Tennessee, United States.
Categorie:
Climate Change, Environment
sono stati aggiornati
23 apr 2017 anni
Indicatori delle variazioni dei valori per anni
Minima:
0.613
1 gen 1973 anni
Massimo:
0.997
1 gen 2011 anni
Alla data di osservazione
Valore
Variazione assoluta
La variazione rispetto al valore precedente
1 gen 1972 anni
0.635
+0.635
0.0%
1 gen 1973 anni
0.613
-0.022
-3.48%
1 gen 1974 anni
0.647
+0.034
5.57%
1 gen 1975 anni
0.663
+0.016
2.48%
1 gen 1976 anni
0.652
-0.011
-1.62%
1 gen 1977 anni
0.659
+0.007
1.07%
1 gen 1978 anni
0.678
+0.019
2.86%
1 gen 1979 anni
0.687
+0.009
1.27%
1 gen 1980 anni
0.755
+0.068
9.88%
1 gen 1981 anni
0.759
+0.005
0.62%
1 gen 1982 anni
0.793
+0.034
4.47%
1 gen 1983 anni
0.76
-0.033
-4.22%
1 gen 1984 anni
0.77
+0.011
1.41%
1 gen 1985 anni
0.797
+0.026
3.44%
1 gen 1986 anni
0.784
-0.013
-1.61%
1 gen 1987 anni
0.774
-0.01
-1.24%
1 gen 1988 anni
0.811
+0.036
4.68%
1 gen 1989 anni
0.837
+0.026
3.26%
1 gen 1990 anni
0.796
-0.041
-4.93%
1 gen 1991 anni
0.813
+0.018
2.2%
1 gen 1992 anni
0.809
-0.004
-0.5%
1 gen 1993 anni
0.91
+0.101
12.5%
1 gen 1994 anni
0.874
-0.037
-4.04%
1 gen 1995 anni
0.854
-0.02
-2.25%
1 gen 1996 anni
0.846
-0.008
-0.96%
1 gen 1997 anni
0.882
+0.037
4.32%
1 gen 1998 anni
0.851
-0.031
-3.53%
1 gen 1999 anni
0.864
+0.013
1.55%
1 gen 2000 anni
0.87
+0.006
0.67%
1 gen 2001 anni
0.882
+0.012
1.35%
1 gen 2002 anni
0.886
+0.004
0.5%
1 gen 2003 anni
0.826
-0.06
-6.76%
1 gen 2004 anni
0.904
+0.078
9.45%
1 gen 2005 anni
0.931
+0.026
2.89%
1 gen 2006 anni
0.911
-0.019
-2.09%
1 gen 2007 anni
0.934
+0.022
2.45%
1 gen 2008 anni
0.991
+0.058
6.18%
1 gen 2009 anni
0.986
-0.006
-0.56%
1 gen 2010 anni
0.97
-0.016
-1.63%
1 gen 2011 anni
0.997
+0.027
2.83%
1 gen 2012 anni
0.99
-0.007
-0.75%
1 gen 2013 anni
0.958
-0.032
-3.2%
1 gen 2014 anni
0.965
+0.008
0.79%
Classificazione dei paesi secondo i statistiche attuali per anni


Commenti: