29
/it/
it
AIzaSyAYiBZKx7MnpbEhh9jyipgxe19OcubqV5w
April 1, 2024
215089
Oman
OMN
true
2
1
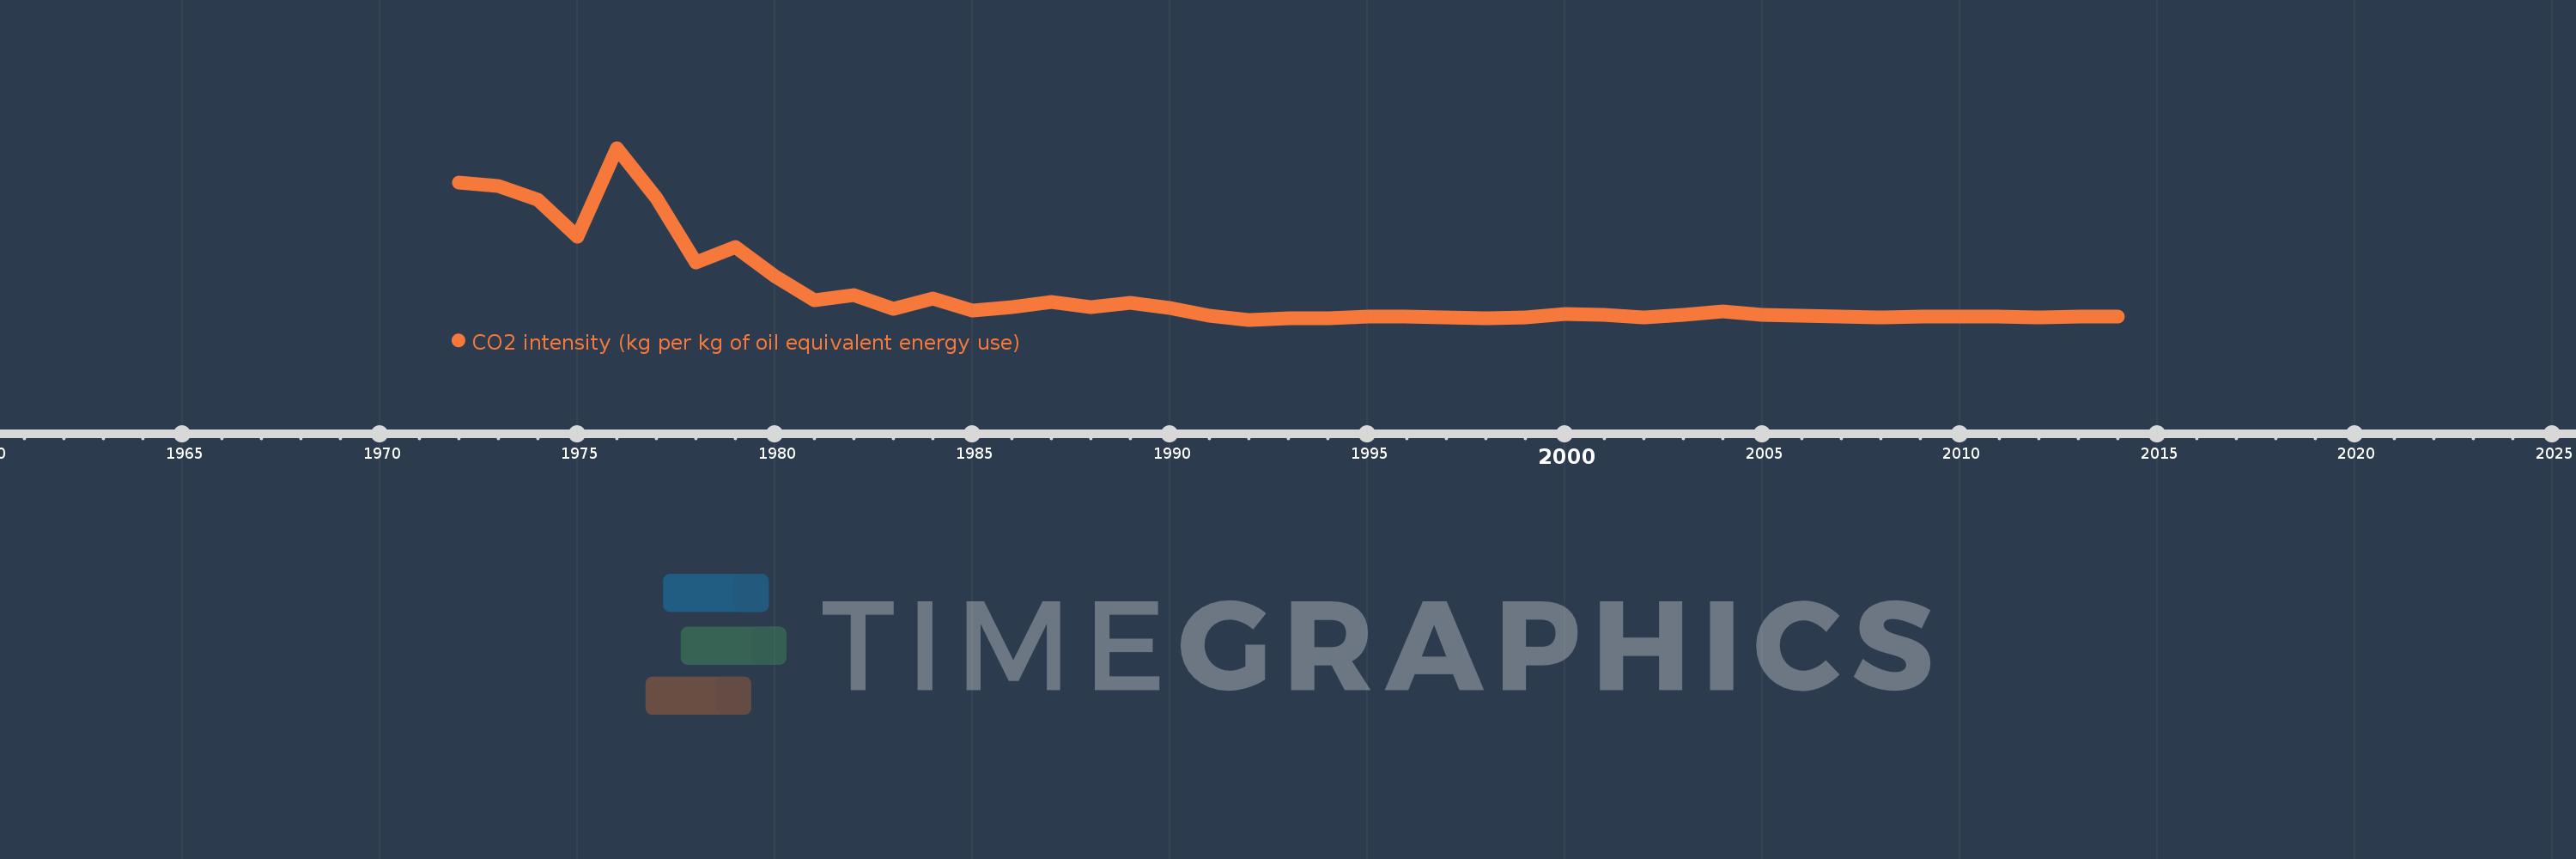
CO2 intensity (kg per kg of oil equivalent energy use)
2014,2013,2012,2011,2010,2009,2008,2007,2006,2005,2004,2003,2002,2001,2000,1999,1998,1997,1996,1995,1994,1993,1992,1991,1990,1989,1988,1987,1986,1985,1984,1983,1982,1981,1980,1979,1978,1977,1976,1975,1974,1973,1972
Queste statistiche in altri paesi:
AlbaniaAlgeriaAngolaAntigua and BarbudaArab WorldArgentinaArmeniaAustraliaAustriaAzerbaijanBahamas, TheBahrainBangladeshBarbadosBelarusBelgiumBelizeBeninBhutanBoliviaBosnia and HerzegovinaBotswanaBrazilBrunei DarussalamBulgariaCabo VerdeCambodiaCameroonCanadaCaribbean small statesCentral Europe and the BalticsChileChinaColombiaComorosCongo, Dem. Rep.Congo, Rep.Costa RicaCote d'IvoireCroatiaCubaCuracaoCyprusCzech RepublicDenmarkDjiboutiDominicaDominican RepublicEarly-demographic dividendEast Asia & PacificEast Asia & Pacific (excluding high income)East Asia & Pacific (IDA & IBRD countries)EcuadorEgypt, Arab Rep.El SalvadorEquatorial GuineaEritreaEstoniaEthiopiaEuro areaEurope & Central AsiaEurope & Central Asia (excluding high income)Europe & Central Asia (IDA & IBRD countries)European UnionFijiFinlandFragile and conflict affected situationsFranceGabonGambia, TheGeorgiaGermanyGhanaGibraltarGreeceGrenadaGuatemalaGuinea-BissauGuyanaHaitiHeavily indebted poor countries (HIPC)High incomeHondurasHong Kong SAR, ChinaHungaryIBRD onlyIcelandIDA & IBRD totalIDA blendIDA onlyIDA totalIndiaIndonesiaIran, Islamic Rep.IraqIrelandIsraelItalyJamaicaJapanJordanKazakhstanKenyaKiribatiKorea, Dem. People’s Rep.Korea, Rep.KuwaitKyrgyz RepublicLate-demographic dividendLatin America & Caribbean Latin America & Caribbean (excluding high income)Latin America & the Caribbean (IDA & IBRD countries)LatviaLeast developed countries: UN classificationLebanonLesothoLibyaLithuaniaLow & middle incomeLow incomeLower middle incomeLuxembourgMacedonia, FYRMalaysiaMaldivesMaltaMarshall IslandsMauritiusMexicoMiddle East & North AfricaMiddle East & North Africa (excluding high income)Middle East & North Africa (IDA & IBRD countries)Middle incomeMoldovaMongoliaMontenegroMoroccoMozambiqueMyanmarNamibiaNepalNetherlandsNew ZealandNicaraguaNigerNigeriaNorth AmericaNorwayOECD membersOmanOther small statesPacific island small statesPakistanPalauPanamaParaguayPeruPhilippinesPolandPortugalPost-demographic dividendPre-demographic dividendQatarRomaniaRussian FederationSamoaSao Tome and PrincipeSaudi ArabiaSenegalSerbiaSeychellesSingaporeSlovak RepublicSloveniaSmall statesSolomon IslandsSouth AfricaSouth AsiaSouth Asia (IDA & IBRD)South SudanSpainSri LankaSt. Kitts and NevisSt. LuciaSt. Vincent and the GrenadinesSub-Saharan Africa Sub-Saharan Africa (excluding high income)Sub-Saharan Africa (IDA & IBRD countries)SudanSurinameSwazilandSwedenSwitzerlandSyrian Arab RepublicTajikistanTanzaniaThailandTimor-LesteTogoTongaTrinidad and TobagoTunisiaTurkeyTurkmenistanUkraineUnited Arab EmiratesUnited KingdomUnited StatesUpper middle incomeUruguayUzbekistanVanuatuVenezuela, RBVietnamWorldYemen, Rep.ZambiaZimbabwe Linea del tempo:
Questa scala temporale mostra un grafico dal 1972 anno al 2014 anno. Oman. I dati fino ad 1971 anno non disponibili. Il numero di osservazioni attuali secondo i date: 43.
La fonte (nome):
Indicatori dello sviluppo mondiale
La fonte (organizzazione):
Carbon Dioxide Information Analysis Center, Environmental Sciences Division, Oak Ridge National Laboratory, Tennessee, United States.
Categorie:
Climate Change, Environment
sono stati aggiornati
23 apr 2017 anni
Indicatori delle variazioni dei valori per anni
Minima:
2.016
1 gen 1992 anni
Massimo:
30.379
1 gen 1976 anni
Alla data di osservazione
Valore
Variazione assoluta
La variazione rispetto al valore precedente
1 gen 1972 anni
24.658
+24.658
0.0%
1 gen 1973 anni
24.026
-0.632
-2.56%
1 gen 1974 anni
21.87
-2.156
-8.97%
1 gen 1975 anni
15.673
-6.198
-28.34%
1 gen 1976 anni
30.379
+14.707
93.84%
1 gen 1977 anni
22.051
-8.329
-27.42%
1 gen 1978 anni
11.423
-10.627
-48.2%
1 gen 1979 anni
14.033
+2.61
22.85%
1 gen 1980 anni
9.159
-4.874
-34.73%
1 gen 1981 anni
5.254
-3.905
-42.64%
1 gen 1982 anni
6.14
+0.886
16.86%
1 gen 1983 anni
3.86
-2.28
-37.14%
1 gen 1984 anni
5.508
+1.648
42.71%
1 gen 1985 anni
3.585
-1.923
-34.91%
1 gen 1986 anni
4.104
+0.519
14.48%
1 gen 1987 anni
4.969
+0.865
21.07%
1 gen 1988 anni
4.135
-0.834
-16.78%
1 gen 1989 anni
4.795
+0.66
15.95%
1 gen 1990 anni
3.926
-0.869
-18.12%
1 gen 1991 anni
2.699
-1.227
-31.26%
1 gen 1992 anni
2.016
-0.683
-25.31%
1 gen 1993 anni
2.213
+0.198
9.81%
1 gen 1994 anni
2.268
+0.055
2.48%
1 gen 1995 anni
2.534
+0.266
11.71%
1 gen 1996 anni
2.606
+0.072
2.85%
1 gen 1997 anni
2.408
-0.198
-7.58%
1 gen 1998 anni
2.296
-0.113
-4.67%
1 gen 1999 anni
2.438
+0.142
6.18%
1 gen 2000 anni
2.941
+0.503
20.65%
1 gen 2001 anni
2.841
-0.1
-3.4%
1 gen 2002 anni
2.382
-0.46
-16.18%
1 gen 2003 anni
2.818
+0.436
18.31%
1 gen 2004 anni
3.352
+0.534
18.94%
1 gen 2005 anni
2.803
-0.549
-16.38%
1 gen 2006 anni
2.692
-0.111
-3.95%
1 gen 2007 anni
2.571
-0.121
-4.48%
1 gen 2008 anni
2.448
-0.123
-4.79%
1 gen 2009 anni
2.53
+0.082
3.34%
1 gen 2010 anni
2.575
+0.046
1.8%
1 gen 2011 anni
2.518
-0.058
-2.24%
1 gen 2012 anni
2.448
-0.07
-2.78%
1 gen 2013 anni
2.501
+0.053
2.18%
1 gen 2014 anni
2.513
+0.012
0.47%
Classificazione dei paesi secondo i statistiche attuali per anni


Commenti: