29
/it/
it
AIzaSyAYiBZKx7MnpbEhh9jyipgxe19OcubqV5w
April 1, 2024
224646
Poland
POL
true
2
1
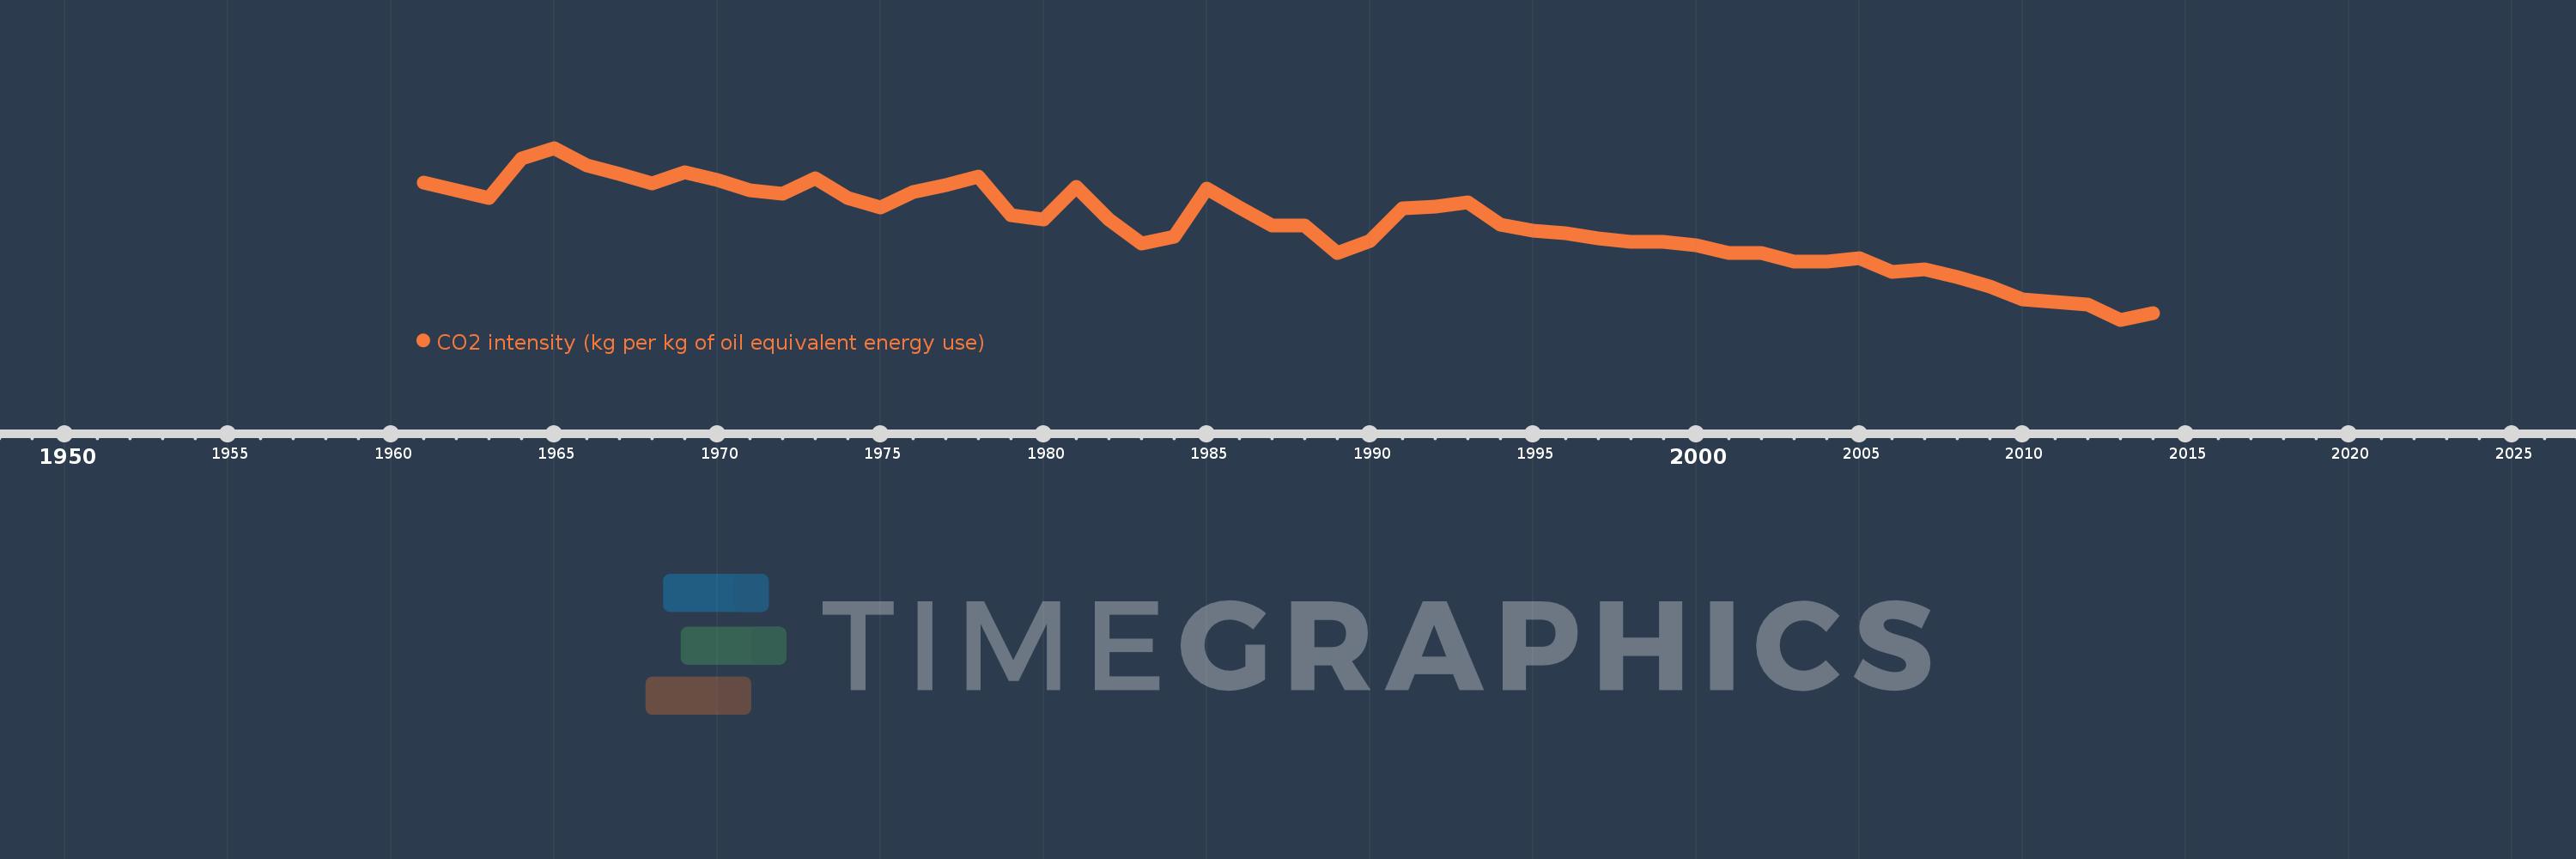
CO2 intensity (kg per kg of oil equivalent energy use)
2014,2013,2012,2011,2010,2009,2008,2007,2006,2005,2004,2003,2002,2001,2000,1999,1998,1997,1996,1995,1994,1993,1992,1991,1990,1989,1988,1987,1986,1985,1984,1983,1982,1981,1980,1979,1978,1977,1976,1975,1974,1973,1972,1971,1970,1969,1968,1967,1966,1965,1964,1963,1962,1961
Queste statistiche in altri paesi:
AlbaniaAlgeriaAngolaAntigua and BarbudaArab WorldArgentinaArmeniaAustraliaAustriaAzerbaijanBahamas, TheBahrainBangladeshBarbadosBelarusBelgiumBelizeBeninBhutanBoliviaBosnia and HerzegovinaBotswanaBrazilBrunei DarussalamBulgariaCabo VerdeCambodiaCameroonCanadaCaribbean small statesCentral Europe and the BalticsChileChinaColombiaComorosCongo, Dem. Rep.Congo, Rep.Costa RicaCote d'IvoireCroatiaCubaCuracaoCyprusCzech RepublicDenmarkDjiboutiDominicaDominican RepublicEarly-demographic dividendEast Asia & PacificEast Asia & Pacific (excluding high income)East Asia & Pacific (IDA & IBRD countries)EcuadorEgypt, Arab Rep.El SalvadorEquatorial GuineaEritreaEstoniaEthiopiaEuro areaEurope & Central AsiaEurope & Central Asia (excluding high income)Europe & Central Asia (IDA & IBRD countries)European UnionFijiFinlandFragile and conflict affected situationsFranceGabonGambia, TheGeorgiaGermanyGhanaGibraltarGreeceGrenadaGuatemalaGuinea-BissauGuyanaHaitiHeavily indebted poor countries (HIPC)High incomeHondurasHong Kong SAR, ChinaHungaryIBRD onlyIcelandIDA & IBRD totalIDA blendIDA onlyIDA totalIndiaIndonesiaIran, Islamic Rep.IraqIrelandIsraelItalyJamaicaJapanJordanKazakhstanKenyaKiribatiKorea, Dem. People’s Rep.Korea, Rep.KuwaitKyrgyz RepublicLate-demographic dividendLatin America & Caribbean Latin America & Caribbean (excluding high income)Latin America & the Caribbean (IDA & IBRD countries)LatviaLeast developed countries: UN classificationLebanonLesothoLibyaLithuaniaLow & middle incomeLow incomeLower middle incomeLuxembourgMacedonia, FYRMalaysiaMaldivesMaltaMarshall IslandsMauritiusMexicoMiddle East & North AfricaMiddle East & North Africa (excluding high income)Middle East & North Africa (IDA & IBRD countries)Middle incomeMoldovaMongoliaMontenegroMoroccoMozambiqueMyanmarNamibiaNepalNetherlandsNew ZealandNicaraguaNigerNigeriaNorth AmericaNorwayOECD membersOmanOther small statesPacific island small statesPakistanPalauPanamaParaguayPeruPhilippinesPolandPortugalPost-demographic dividendPre-demographic dividendQatarRomaniaRussian FederationSamoaSao Tome and PrincipeSaudi ArabiaSenegalSerbiaSeychellesSingaporeSlovak RepublicSloveniaSmall statesSolomon IslandsSouth AfricaSouth AsiaSouth Asia (IDA & IBRD)South SudanSpainSri LankaSt. Kitts and NevisSt. LuciaSt. Vincent and the GrenadinesSub-Saharan Africa Sub-Saharan Africa (excluding high income)Sub-Saharan Africa (IDA & IBRD countries)SudanSurinameSwazilandSwedenSwitzerlandSyrian Arab RepublicTajikistanTanzaniaThailandTimor-LesteTogoTongaTrinidad and TobagoTunisiaTurkeyTurkmenistanUkraineUnited Arab EmiratesUnited KingdomUnited StatesUpper middle incomeUruguayUzbekistanVanuatuVenezuela, RBVietnamWorldYemen, Rep.ZambiaZimbabwe Linea del tempo:
Questa scala temporale mostra un grafico dal 1961 anno al 2014 anno. Poland. I dati fino ad 1960 anno non disponibili. Il numero di osservazioni attuali secondo i date: 54.
La fonte (nome):
Indicatori dello sviluppo mondiale
La fonte (organizzazione):
Carbon Dioxide Information Analysis Center, Environmental Sciences Division, Oak Ridge National Laboratory, Tennessee, United States.
Categorie:
Climate Change, Environment
sono stati aggiornati
23 apr 2017 anni
Indicatori delle variazioni dei valori per anni
Minima:
3.07
1 gen 2013 anni
Massimo:
3.844
1 gen 1965 anni
Alla data di osservazione
Valore
Variazione assoluta
La variazione rispetto al valore precedente
1 gen 1961 anni
3.687
+3.687
0.0%
1 gen 1962 anni
3.655
-0.032
-0.88%
1 gen 1963 anni
3.619
-0.036
-0.99%
1 gen 1964 anni
3.795
+0.176
4.86%
1 gen 1965 anni
3.844
+0.049
1.29%
1 gen 1966 anni
3.765
-0.078
-2.04%
1 gen 1967 anni
3.725
-0.04
-1.06%
1 gen 1968 anni
3.686
-0.039
-1.06%
1 gen 1969 anni
3.733
+0.047
1.26%
1 gen 1970 anni
3.7
-0.033
-0.87%
1 gen 1971 anni
3.655
-0.045
-1.22%
1 gen 1972 anni
3.637
-0.018
-0.49%
1 gen 1973 anni
3.706
+0.068
1.88%
1 gen 1974 anni
3.619
-0.086
-2.33%
1 gen 1975 anni
3.574
-0.045
-1.26%
1 gen 1976 anni
3.645
+0.071
1.99%
1 gen 1977 anni
3.678
+0.033
0.91%
1 gen 1978 anni
3.715
+0.037
1.0%
1 gen 1979 anni
3.542
-0.172
-4.64%
1 gen 1980 anni
3.521
-0.021
-0.6%
1 gen 1981 anni
3.669
+0.148
4.2%
1 gen 1982 anni
3.52
-0.149
-4.07%
1 gen 1983 anni
3.415
-0.105
-2.98%
1 gen 1984 anni
3.446
+0.031
0.92%
1 gen 1985 anni
3.661
+0.214
6.22%
1 gen 1986 anni
3.576
-0.085
-2.32%
1 gen 1987 anni
3.494
-0.082
-2.29%
1 gen 1988 anni
3.494
+0.0
0.01%
1 gen 1989 anni
3.372
-0.123
-3.51%
1 gen 1990 anni
3.425
+0.054
1.59%
1 gen 1991 anni
3.573
+0.148
4.31%
1 gen 1992 anni
3.58
+0.007
0.2%
1 gen 1993 anni
3.599
+0.019
0.53%
1 gen 1994 anni
3.499
-0.1
-2.77%
1 gen 1995 anni
3.471
-0.028
-0.8%
1 gen 1996 anni
3.46
-0.011
-0.32%
1 gen 1997 anni
3.437
-0.023
-0.68%
1 gen 1998 anni
3.421
-0.015
-0.44%
1 gen 1999 anni
3.422
+0.0
0.01%
1 gen 2000 anni
3.407
-0.014
-0.42%
1 gen 2001 anni
3.371
-0.036
-1.06%
1 gen 2002 anni
3.371
+0.0
0.0%
1 gen 2003 anni
3.332
-0.039
-1.15%
1 gen 2004 anni
3.331
-0.001
-0.04%
1 gen 2005 anni
3.346
+0.015
0.45%
1 gen 2006 anni
3.284
-0.062
-1.85%
1 gen 2007 anni
3.297
+0.013
0.38%
1 gen 2008 anni
3.262
-0.034
-1.04%
1 gen 2009 anni
3.22
-0.042
-1.29%
1 gen 2010 anni
3.163
-0.057
-1.78%
1 gen 2011 anni
3.149
-0.014
-0.45%
1 gen 2012 anni
3.137
-0.011
-0.36%
1 gen 2013 anni
3.07
-0.067
-2.13%
1 gen 2014 anni
3.098
+0.028
0.9%
Classificazione dei paesi secondo i statistiche attuali per anni


Commenti: