29
/it/
it
AIzaSyAYiBZKx7MnpbEhh9jyipgxe19OcubqV5w
April 1, 2024
124580
Egypt, Arab Rep.
EGY
true
2
1
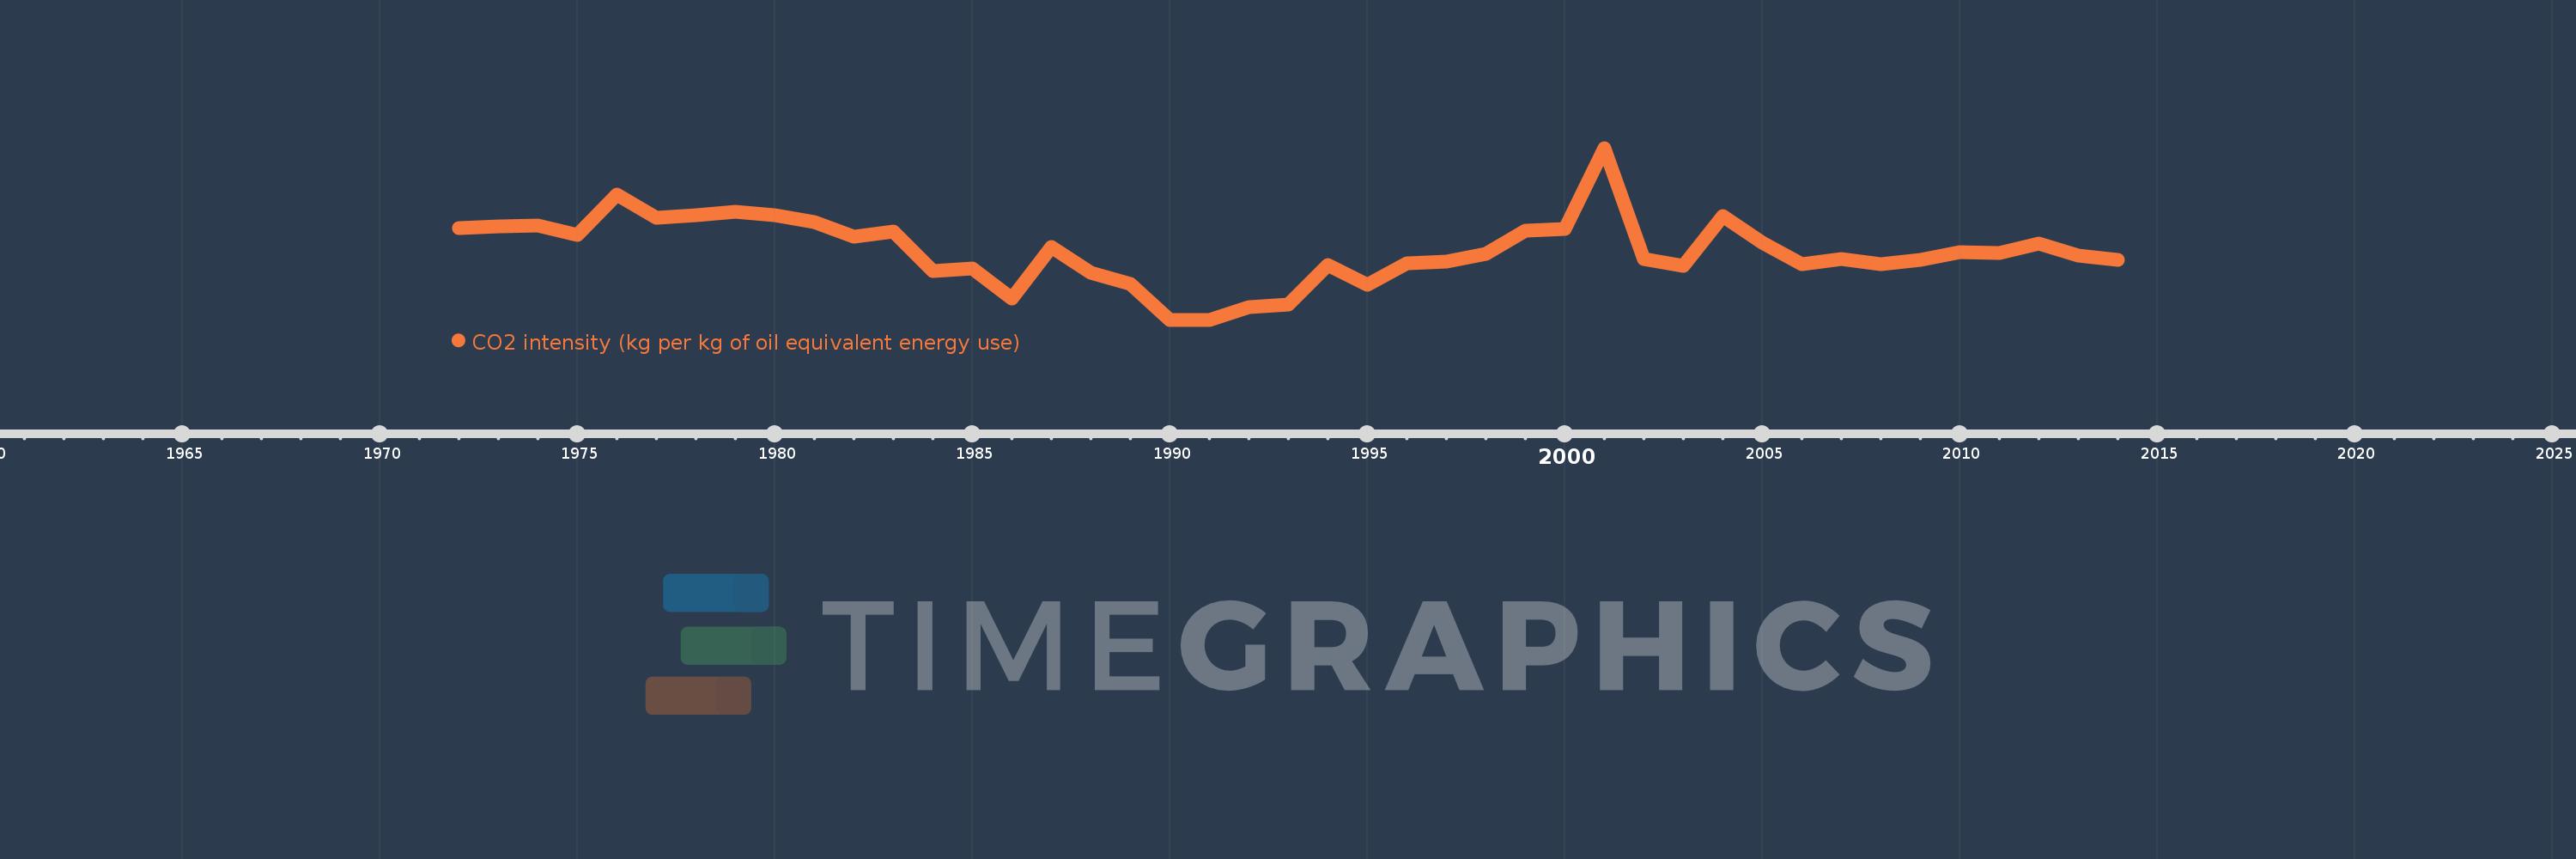
CO2 intensity (kg per kg of oil equivalent energy use)
2014,2013,2012,2011,2010,2009,2008,2007,2006,2005,2004,2003,2002,2001,2000,1999,1998,1997,1996,1995,1994,1993,1992,1991,1990,1989,1988,1987,1986,1985,1984,1983,1982,1981,1980,1979,1978,1977,1976,1975,1974,1973,1972
Queste statistiche in altri paesi:
AlbaniaAlgeriaAngolaAntigua and BarbudaArab WorldArgentinaArmeniaAustraliaAustriaAzerbaijanBahamas, TheBahrainBangladeshBarbadosBelarusBelgiumBelizeBeninBhutanBoliviaBosnia and HerzegovinaBotswanaBrazilBrunei DarussalamBulgariaCabo VerdeCambodiaCameroonCanadaCaribbean small statesCentral Europe and the BalticsChileChinaColombiaComorosCongo, Dem. Rep.Congo, Rep.Costa RicaCote d'IvoireCroatiaCubaCuracaoCyprusCzech RepublicDenmarkDjiboutiDominicaDominican RepublicEarly-demographic dividendEast Asia & PacificEast Asia & Pacific (excluding high income)East Asia & Pacific (IDA & IBRD countries)EcuadorEgypt, Arab Rep.El SalvadorEquatorial GuineaEritreaEstoniaEthiopiaEuro areaEurope & Central AsiaEurope & Central Asia (excluding high income)Europe & Central Asia (IDA & IBRD countries)European UnionFijiFinlandFragile and conflict affected situationsFranceGabonGambia, TheGeorgiaGermanyGhanaGibraltarGreeceGrenadaGuatemalaGuinea-BissauGuyanaHaitiHeavily indebted poor countries (HIPC)High incomeHondurasHong Kong SAR, ChinaHungaryIBRD onlyIcelandIDA & IBRD totalIDA blendIDA onlyIDA totalIndiaIndonesiaIran, Islamic Rep.IraqIrelandIsraelItalyJamaicaJapanJordanKazakhstanKenyaKiribatiKorea, Dem. People’s Rep.Korea, Rep.KuwaitKyrgyz RepublicLate-demographic dividendLatin America & Caribbean Latin America & Caribbean (excluding high income)Latin America & the Caribbean (IDA & IBRD countries)LatviaLeast developed countries: UN classificationLebanonLesothoLibyaLithuaniaLow & middle incomeLow incomeLower middle incomeLuxembourgMacedonia, FYRMalaysiaMaldivesMaltaMarshall IslandsMauritiusMexicoMiddle East & North AfricaMiddle East & North Africa (excluding high income)Middle East & North Africa (IDA & IBRD countries)Middle incomeMoldovaMongoliaMontenegroMoroccoMozambiqueMyanmarNamibiaNepalNetherlandsNew ZealandNicaraguaNigerNigeriaNorth AmericaNorwayOECD membersOmanOther small statesPacific island small statesPakistanPalauPanamaParaguayPeruPhilippinesPolandPortugalPost-demographic dividendPre-demographic dividendQatarRomaniaRussian FederationSamoaSao Tome and PrincipeSaudi ArabiaSenegalSerbiaSeychellesSingaporeSlovak RepublicSloveniaSmall statesSolomon IslandsSouth AfricaSouth AsiaSouth Asia (IDA & IBRD)South SudanSpainSri LankaSt. Kitts and NevisSt. LuciaSt. Vincent and the GrenadinesSub-Saharan Africa Sub-Saharan Africa (excluding high income)Sub-Saharan Africa (IDA & IBRD countries)SudanSurinameSwazilandSwedenSwitzerlandSyrian Arab RepublicTajikistanTanzaniaThailandTimor-LesteTogoTongaTrinidad and TobagoTunisiaTurkeyTurkmenistanUkraineUnited Arab EmiratesUnited KingdomUnited StatesUpper middle incomeUruguayUzbekistanVanuatuVenezuela, RBVietnamWorldYemen, Rep.ZambiaZimbabwe Linea del tempo:
Questa scala temporale mostra un grafico dal 1972 anno al 2014 anno. Egypt, Arab Rep.. I dati fino ad 1971 anno non disponibili. Il numero di osservazioni attuali secondo i date: 43.
La fonte (nome):
Indicatori dello sviluppo mondiale
La fonte (organizzazione):
Carbon Dioxide Information Analysis Center, Environmental Sciences Division, Oak Ridge National Laboratory, Tennessee, United States.
Categorie:
Climate Change, Environment
sono stati aggiornati
23 apr 2017 anni
Indicatori delle variazioni dei valori per anni
Minima:
2.354
1 gen 1990 anni
Massimo:
3.482
1 gen 2001 anni
Alla data di osservazione
Valore
Variazione assoluta
La variazione rispetto al valore precedente
1 gen 1972 anni
2.955
+2.955
0.0%
1 gen 1973 anni
2.966
+0.011
0.37%
1 gen 1974 anni
2.971
+0.005
0.18%
1 gen 1975 anni
2.913
-0.059
-1.97%
1 gen 1976 anni
3.176
+0.263
9.04%
1 gen 1977 anni
3.024
-0.152
-4.77%
1 gen 1978 anni
3.041
+0.016
0.53%
1 gen 1979 anni
3.063
+0.022
0.73%
1 gen 1980 anni
3.041
-0.022
-0.71%
1 gen 1981 anni
2.997
-0.044
-1.45%
1 gen 1982 anni
2.898
-0.099
-3.3%
1 gen 1983 anni
2.934
+0.036
1.24%
1 gen 1984 anni
2.671
-0.263
-8.97%
1 gen 1985 anni
2.693
+0.022
0.84%
1 gen 1986 anni
2.492
-0.201
-7.47%
1 gen 1987 anni
2.829
+0.337
13.53%
1 gen 1988 anni
2.664
-0.165
-5.84%
1 gen 1989 anni
2.592
-0.072
-2.71%
1 gen 1990 anni
2.354
-0.238
-9.18%
1 gen 1991 anni
2.355
+0.001
0.02%
1 gen 1992 anni
2.439
+0.085
3.59%
1 gen 1993 anni
2.454
+0.015
0.61%
1 gen 1994 anni
2.713
+0.259
10.55%
1 gen 1995 anni
2.583
-0.13
-4.81%
1 gen 1996 anni
2.725
+0.142
5.51%
1 gen 1997 anni
2.737
+0.012
0.42%
1 gen 1998 anni
2.786
+0.05
1.82%
1 gen 1999 anni
2.938
+0.151
5.44%
1 gen 2000 anni
2.948
+0.01
0.34%
1 gen 2001 anni
3.482
+0.534
18.12%
1 gen 2002 anni
2.752
-0.73
-20.95%
1 gen 2003 anni
2.706
-0.047
-1.71%
1 gen 2004 anni
3.032
+0.326
12.06%
1 gen 2005 anni
2.861
-0.171
-5.64%
1 gen 2006 anni
2.721
-0.14
-4.91%
1 gen 2007 anni
2.75
+0.029
1.08%
1 gen 2008 anni
2.718
-0.032
-1.15%
1 gen 2009 anni
2.748
+0.03
1.1%
1 gen 2010 anni
2.796
+0.048
1.75%
1 gen 2011 anni
2.795
-0.001
-0.03%
1 gen 2012 anni
2.854
+0.058
2.09%
1 gen 2013 anni
2.775
-0.079
-2.76%
1 gen 2014 anni
2.747
-0.028
-1.01%
Classificazione dei paesi secondo i statistiche attuali per anni


Commenti: