29
/it/
it
AIzaSyAYiBZKx7MnpbEhh9jyipgxe19OcubqV5w
April 1, 2024
260638
Tanzania
TZA
true
2
1
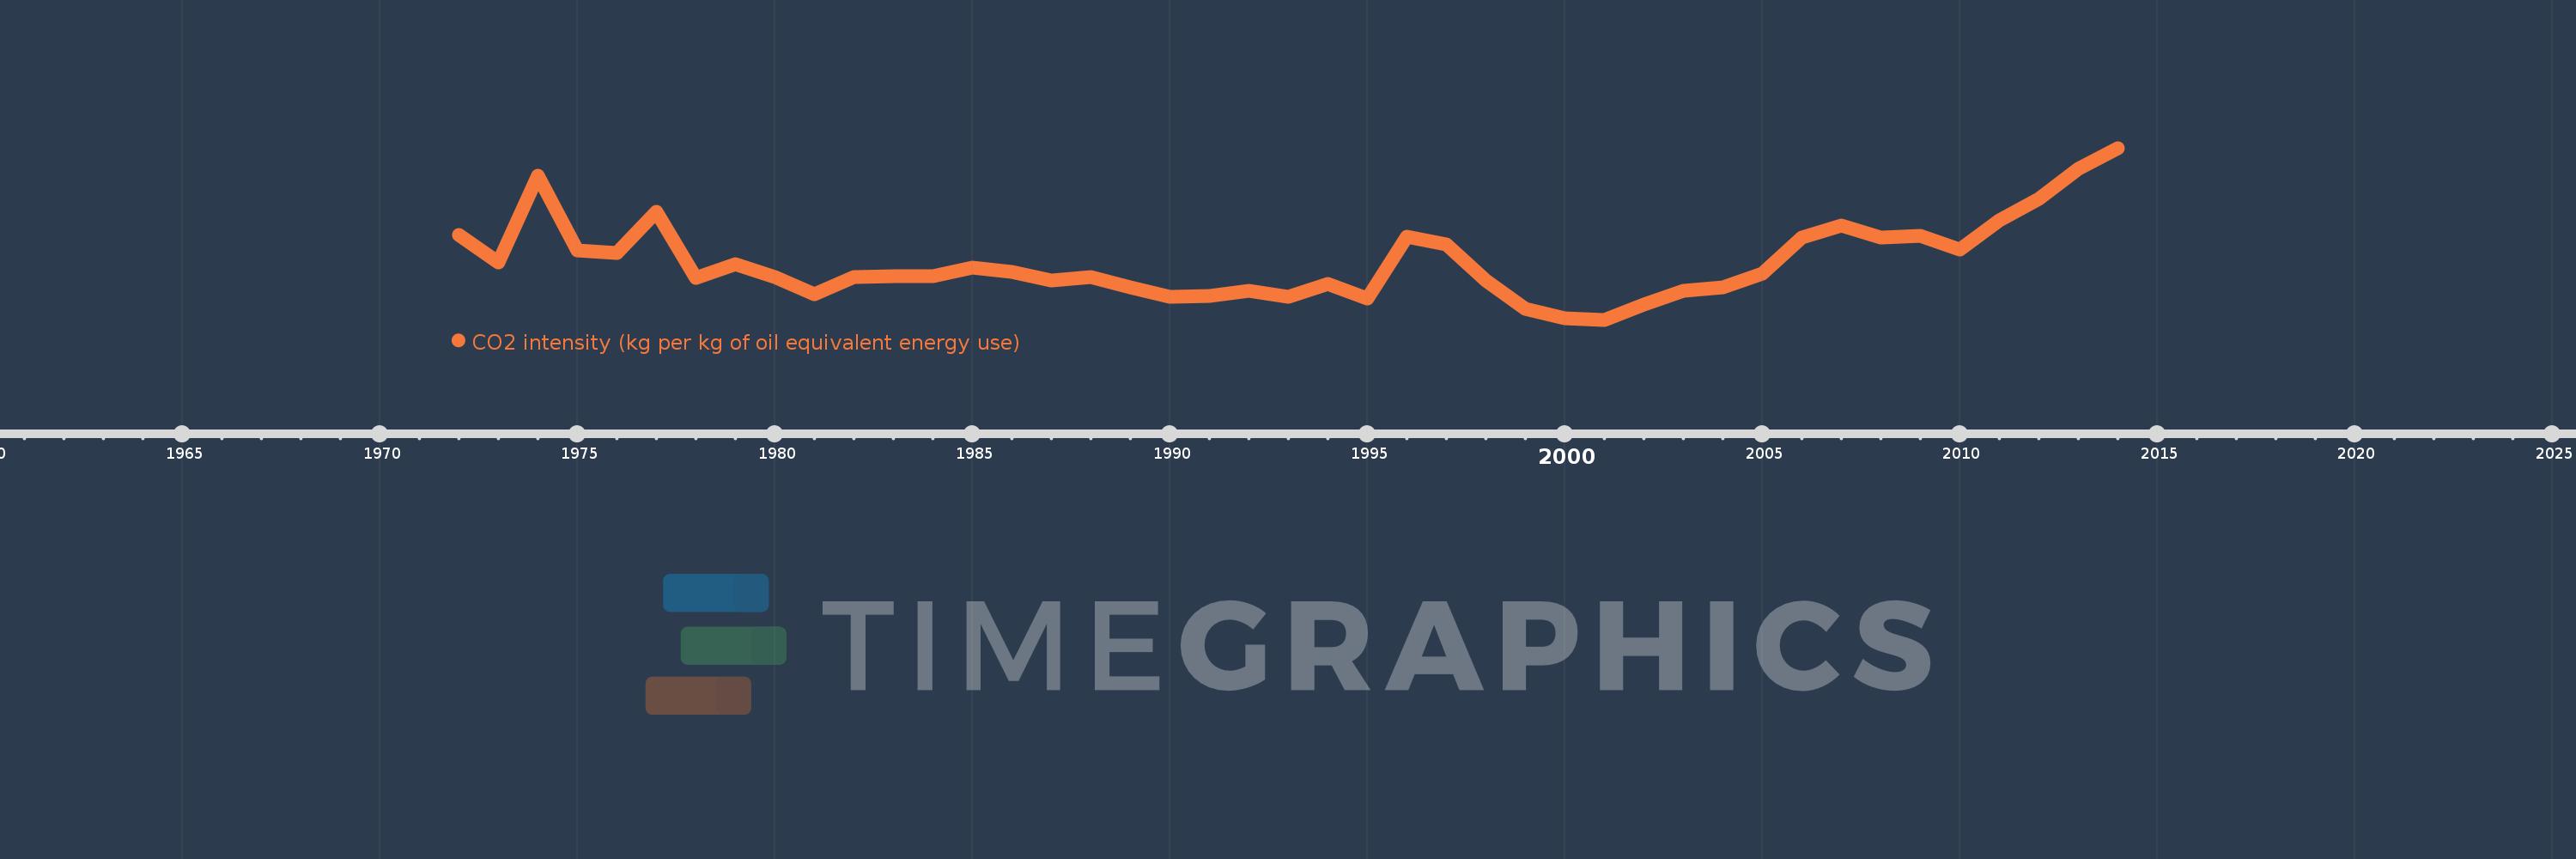
CO2 intensity (kg per kg of oil equivalent energy use)
2014,2013,2012,2011,2010,2009,2008,2007,2006,2005,2004,2003,2002,2001,2000,1999,1998,1997,1996,1995,1994,1993,1992,1991,1990,1989,1988,1987,1986,1985,1984,1983,1982,1981,1980,1979,1978,1977,1976,1975,1974,1973,1972
Queste statistiche in altri paesi:
AlbaniaAlgeriaAngolaAntigua and BarbudaArab WorldArgentinaArmeniaAustraliaAustriaAzerbaijanBahamas, TheBahrainBangladeshBarbadosBelarusBelgiumBelizeBeninBhutanBoliviaBosnia and HerzegovinaBotswanaBrazilBrunei DarussalamBulgariaCabo VerdeCambodiaCameroonCanadaCaribbean small statesCentral Europe and the BalticsChileChinaColombiaComorosCongo, Dem. Rep.Congo, Rep.Costa RicaCote d'IvoireCroatiaCubaCuracaoCyprusCzech RepublicDenmarkDjiboutiDominicaDominican RepublicEarly-demographic dividendEast Asia & PacificEast Asia & Pacific (excluding high income)East Asia & Pacific (IDA & IBRD countries)EcuadorEgypt, Arab Rep.El SalvadorEquatorial GuineaEritreaEstoniaEthiopiaEuro areaEurope & Central AsiaEurope & Central Asia (excluding high income)Europe & Central Asia (IDA & IBRD countries)European UnionFijiFinlandFragile and conflict affected situationsFranceGabonGambia, TheGeorgiaGermanyGhanaGibraltarGreeceGrenadaGuatemalaGuinea-BissauGuyanaHaitiHeavily indebted poor countries (HIPC)High incomeHondurasHong Kong SAR, ChinaHungaryIBRD onlyIcelandIDA & IBRD totalIDA blendIDA onlyIDA totalIndiaIndonesiaIran, Islamic Rep.IraqIrelandIsraelItalyJamaicaJapanJordanKazakhstanKenyaKiribatiKorea, Dem. People’s Rep.Korea, Rep.KuwaitKyrgyz RepublicLate-demographic dividendLatin America & Caribbean Latin America & Caribbean (excluding high income)Latin America & the Caribbean (IDA & IBRD countries)LatviaLeast developed countries: UN classificationLebanonLesothoLibyaLithuaniaLow & middle incomeLow incomeLower middle incomeLuxembourgMacedonia, FYRMalaysiaMaldivesMaltaMarshall IslandsMauritiusMexicoMiddle East & North AfricaMiddle East & North Africa (excluding high income)Middle East & North Africa (IDA & IBRD countries)Middle incomeMoldovaMongoliaMontenegroMoroccoMozambiqueMyanmarNamibiaNepalNetherlandsNew ZealandNicaraguaNigerNigeriaNorth AmericaNorwayOECD membersOmanOther small statesPacific island small statesPakistanPalauPanamaParaguayPeruPhilippinesPolandPortugalPost-demographic dividendPre-demographic dividendQatarRomaniaRussian FederationSamoaSao Tome and PrincipeSaudi ArabiaSenegalSerbiaSeychellesSingaporeSlovak RepublicSloveniaSmall statesSolomon IslandsSouth AfricaSouth AsiaSouth Asia (IDA & IBRD)South SudanSpainSri LankaSt. Kitts and NevisSt. LuciaSt. Vincent and the GrenadinesSub-Saharan Africa Sub-Saharan Africa (excluding high income)Sub-Saharan Africa (IDA & IBRD countries)SudanSurinameSwazilandSwedenSwitzerlandSyrian Arab RepublicTajikistanTanzaniaThailandTimor-LesteTogoTongaTrinidad and TobagoTunisiaTurkeyTurkmenistanUkraineUnited Arab EmiratesUnited KingdomUnited StatesUpper middle incomeUruguayUzbekistanVanuatuVenezuela, RBVietnamWorldYemen, Rep.ZambiaZimbabwe Linea del tempo:
Questa scala temporale mostra un grafico dal 1972 anno al 2014 anno. Tanzania. I dati fino ad 1971 anno non disponibili. Il numero di osservazioni attuali secondo i date: 43.
La fonte (nome):
Indicatori dello sviluppo mondiale
La fonte (organizzazione):
Carbon Dioxide Information Analysis Center, Environmental Sciences Division, Oak Ridge National Laboratory, Tennessee, United States.
Categorie:
Climate Change, Environment
sono stati aggiornati
23 apr 2017 anni
Indicatori delle variazioni dei valori per anni
Minima:
0.197
1 gen 2001 anni
Massimo:
0.456
1 gen 2014 anni
Alla data di osservazione
Valore
Variazione assoluta
La variazione rispetto al valore precedente
1 gen 1972 anni
0.325
+0.325
0.0%
1 gen 1973 anni
0.283
-0.042
-12.85%
1 gen 1974 anni
0.414
+0.131
46.13%
1 gen 1975 anni
0.301
-0.113
-27.37%
1 gen 1976 anni
0.298
-0.003
-1.01%
1 gen 1977 anni
0.36
+0.062
20.94%
1 gen 1978 anni
0.26
-0.1
-27.88%
1 gen 1979 anni
0.281
+0.021
8.25%
1 gen 1980 anni
0.262
-0.019
-6.87%
1 gen 1981 anni
0.235
-0.027
-10.2%
1 gen 1982 anni
0.261
+0.026
11.07%
1 gen 1983 anni
0.263
+0.001
0.57%
1 gen 1984 anni
0.263
+0.001
0.3%
1 gen 1985 anni
0.276
+0.012
4.73%
1 gen 1986 anni
0.269
-0.007
-2.53%
1 gen 1987 anni
0.256
-0.013
-4.81%
1 gen 1988 anni
0.261
+0.005
2.12%
1 gen 1989 anni
0.246
-0.016
-5.99%
1 gen 1990 anni
0.232
-0.014
-5.6%
1 gen 1991 anni
0.233
+0.001
0.36%
1 gen 1992 anni
0.241
+0.009
3.7%
1 gen 1993 anni
0.231
-0.01
-4.29%
1 gen 1994 anni
0.251
+0.02
8.72%
1 gen 1995 anni
0.229
-0.023
-8.98%
1 gen 1996 anni
0.322
+0.094
40.98%
1 gen 1997 anni
0.31
-0.012
-3.77%
1 gen 1998 anni
0.256
-0.054
-17.53%
1 gen 1999 anni
0.213
-0.043
-16.72%
1 gen 2000 anni
0.199
-0.014
-6.61%
1 gen 2001 anni
0.197
-0.002
-1.02%
1 gen 2002 anni
0.22
+0.023
11.79%
1 gen 2003 anni
0.241
+0.021
9.32%
1 gen 2004 anni
0.246
+0.005
2.1%
1 gen 2005 anni
0.266
+0.02
8.21%
1 gen 2006 anni
0.321
+0.055
20.66%
1 gen 2007 anni
0.339
+0.018
5.52%
1 gen 2008 anni
0.321
-0.018
-5.23%
1 gen 2009 anni
0.323
+0.002
0.61%
1 gen 2010 anni
0.303
-0.02
-6.04%
1 gen 2011 anni
0.347
+0.043
14.29%
1 gen 2012 anni
0.379
+0.032
9.24%
1 gen 2013 anni
0.424
+0.046
12.06%
1 gen 2014 anni
0.456
+0.032
7.43%
Classificazione dei paesi secondo i statistiche attuali per anni


Commenti: