29
/it/
it
AIzaSyAYiBZKx7MnpbEhh9jyipgxe19OcubqV5w
April 1, 2024
201344
Morocco
MAR
true
2
1
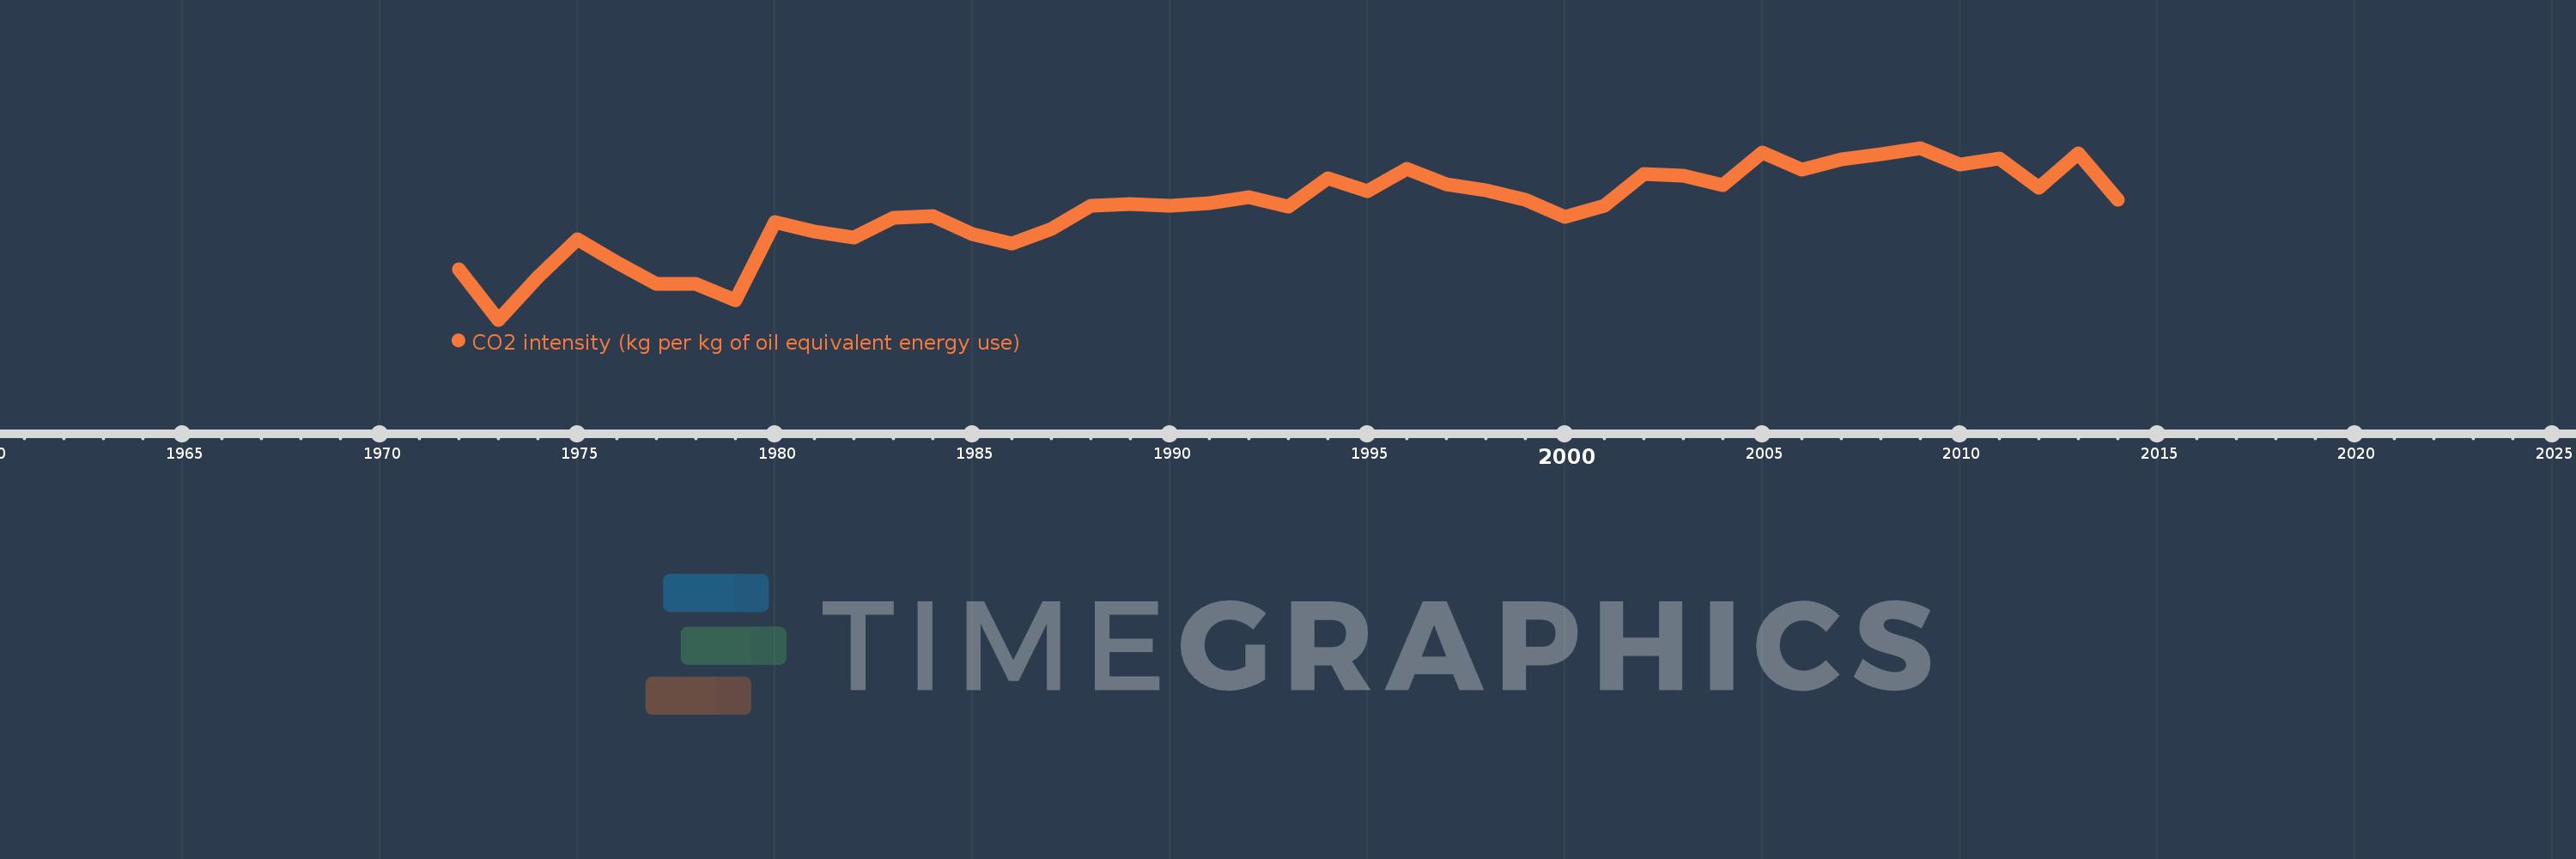
CO2 intensity (kg per kg of oil equivalent energy use)
2014,2013,2012,2011,2010,2009,2008,2007,2006,2005,2004,2003,2002,2001,2000,1999,1998,1997,1996,1995,1994,1993,1992,1991,1990,1989,1988,1987,1986,1985,1984,1983,1982,1981,1980,1979,1978,1977,1976,1975,1974,1973,1972
Queste statistiche in altri paesi:
AlbaniaAlgeriaAngolaAntigua and BarbudaArab WorldArgentinaArmeniaAustraliaAustriaAzerbaijanBahamas, TheBahrainBangladeshBarbadosBelarusBelgiumBelizeBeninBhutanBoliviaBosnia and HerzegovinaBotswanaBrazilBrunei DarussalamBulgariaCabo VerdeCambodiaCameroonCanadaCaribbean small statesCentral Europe and the BalticsChileChinaColombiaComorosCongo, Dem. Rep.Congo, Rep.Costa RicaCote d'IvoireCroatiaCubaCuracaoCyprusCzech RepublicDenmarkDjiboutiDominicaDominican RepublicEarly-demographic dividendEast Asia & PacificEast Asia & Pacific (excluding high income)East Asia & Pacific (IDA & IBRD countries)EcuadorEgypt, Arab Rep.El SalvadorEquatorial GuineaEritreaEstoniaEthiopiaEuro areaEurope & Central AsiaEurope & Central Asia (excluding high income)Europe & Central Asia (IDA & IBRD countries)European UnionFijiFinlandFragile and conflict affected situationsFranceGabonGambia, TheGeorgiaGermanyGhanaGibraltarGreeceGrenadaGuatemalaGuinea-BissauGuyanaHaitiHeavily indebted poor countries (HIPC)High incomeHondurasHong Kong SAR, ChinaHungaryIBRD onlyIcelandIDA & IBRD totalIDA blendIDA onlyIDA totalIndiaIndonesiaIran, Islamic Rep.IraqIrelandIsraelItalyJamaicaJapanJordanKazakhstanKenyaKiribatiKorea, Dem. People’s Rep.Korea, Rep.KuwaitKyrgyz RepublicLate-demographic dividendLatin America & Caribbean Latin America & Caribbean (excluding high income)Latin America & the Caribbean (IDA & IBRD countries)LatviaLeast developed countries: UN classificationLebanonLesothoLibyaLithuaniaLow & middle incomeLow incomeLower middle incomeLuxembourgMacedonia, FYRMalaysiaMaldivesMaltaMarshall IslandsMauritiusMexicoMiddle East & North AfricaMiddle East & North Africa (excluding high income)Middle East & North Africa (IDA & IBRD countries)Middle incomeMoldovaMongoliaMontenegroMoroccoMozambiqueMyanmarNamibiaNepalNetherlandsNew ZealandNicaraguaNigerNigeriaNorth AmericaNorwayOECD membersOmanOther small statesPacific island small statesPakistanPalauPanamaParaguayPeruPhilippinesPolandPortugalPost-demographic dividendPre-demographic dividendQatarRomaniaRussian FederationSamoaSao Tome and PrincipeSaudi ArabiaSenegalSerbiaSeychellesSingaporeSlovak RepublicSloveniaSmall statesSolomon IslandsSouth AfricaSouth AsiaSouth Asia (IDA & IBRD)South SudanSpainSri LankaSt. Kitts and NevisSt. LuciaSt. Vincent and the GrenadinesSub-Saharan Africa Sub-Saharan Africa (excluding high income)Sub-Saharan Africa (IDA & IBRD countries)SudanSurinameSwazilandSwedenSwitzerlandSyrian Arab RepublicTajikistanTanzaniaThailandTimor-LesteTogoTongaTrinidad and TobagoTunisiaTurkeyTurkmenistanUkraineUnited Arab EmiratesUnited KingdomUnited StatesUpper middle incomeUruguayUzbekistanVanuatuVenezuela, RBVietnamWorldYemen, Rep.ZambiaZimbabwe Linea del tempo:
Questa scala temporale mostra un grafico dal 1972 anno al 2014 anno. Morocco. I dati fino ad 1971 anno non disponibili. Il numero di osservazioni attuali secondo i date: 43.
La fonte (nome):
Indicatori dello sviluppo mondiale
La fonte (organizzazione):
Carbon Dioxide Information Analysis Center, Environmental Sciences Division, Oak Ridge National Laboratory, Tennessee, United States.
Categorie:
Climate Change, Environment
sono stati aggiornati
23 apr 2017 anni
Indicatori delle variazioni dei valori per anni
Minima:
2.525
1 gen 1973 anni
Massimo:
3.354
1 gen 2009 anni
Alla data di osservazione
Valore
Variazione assoluta
La variazione rispetto al valore precedente
1 gen 1972 anni
2.77
+2.77
0.0%
1 gen 1973 anni
2.525
-0.245
-8.84%
1 gen 1974 anni
2.733
+0.207
8.2%
1 gen 1975 anni
2.912
+0.179
6.56%
1 gen 1976 anni
2.803
-0.109
-3.74%
1 gen 1977 anni
2.696
-0.107
-3.8%
1 gen 1978 anni
2.697
+0.0
0.02%
1 gen 1979 anni
2.621
-0.076
-2.82%
1 gen 1980 anni
2.998
+0.378
14.41%
1 gen 1981 anni
2.949
-0.05
-1.66%
1 gen 1982 anni
2.92
-0.029
-0.98%
1 gen 1983 anni
3.018
+0.098
3.36%
1 gen 1984 anni
3.027
+0.009
0.29%
1 gen 1985 anni
2.938
-0.089
-2.93%
1 gen 1986 anni
2.891
-0.047
-1.6%
1 gen 1987 anni
2.962
+0.071
2.45%
1 gen 1988 anni
3.077
+0.116
3.9%
1 gen 1989 anni
3.085
+0.008
0.27%
1 gen 1990 anni
3.075
-0.011
-0.35%
1 gen 1991 anni
3.089
+0.014
0.46%
1 gen 1992 anni
3.118
+0.03
0.96%
1 gen 1993 anni
3.07
-0.049
-1.57%
1 gen 1994 anni
3.206
+0.136
4.43%
1 gen 1995 anni
3.144
-0.061
-1.91%
1 gen 1996 anni
3.252
+0.108
3.43%
1 gen 1997 anni
3.178
-0.074
-2.28%
1 gen 1998 anni
3.149
-0.029
-0.92%
1 gen 1999 anni
3.106
-0.043
-1.35%
1 gen 2000 anni
3.023
-0.083
-2.68%
1 gen 2001 anni
3.075
+0.052
1.73%
1 gen 2002 anni
3.227
+0.152
4.93%
1 gen 2003 anni
3.219
-0.007
-0.23%
1 gen 2004 anni
3.176
-0.044
-1.36%
1 gen 2005 anni
3.334
+0.158
4.98%
1 gen 2006 anni
3.249
-0.085
-2.54%
1 gen 2007 anni
3.3
+0.051
1.57%
1 gen 2008 anni
3.325
+0.025
0.76%
1 gen 2009 anni
3.354
+0.029
0.87%
1 gen 2010 anni
3.276
-0.078
-2.34%
1 gen 2011 anni
3.305
+0.03
0.91%
1 gen 2012 anni
3.164
-0.141
-4.28%
1 gen 2013 anni
3.328
+0.164
5.17%
1 gen 2014 anni
3.102
-0.226
-6.79%
Classificazione dei paesi secondo i statistiche attuali per anni


Commenti: