29
/it/
it
AIzaSyAYiBZKx7MnpbEhh9jyipgxe19OcubqV5w
April 1, 2024
135315
Gabon
GAB
true
2
1
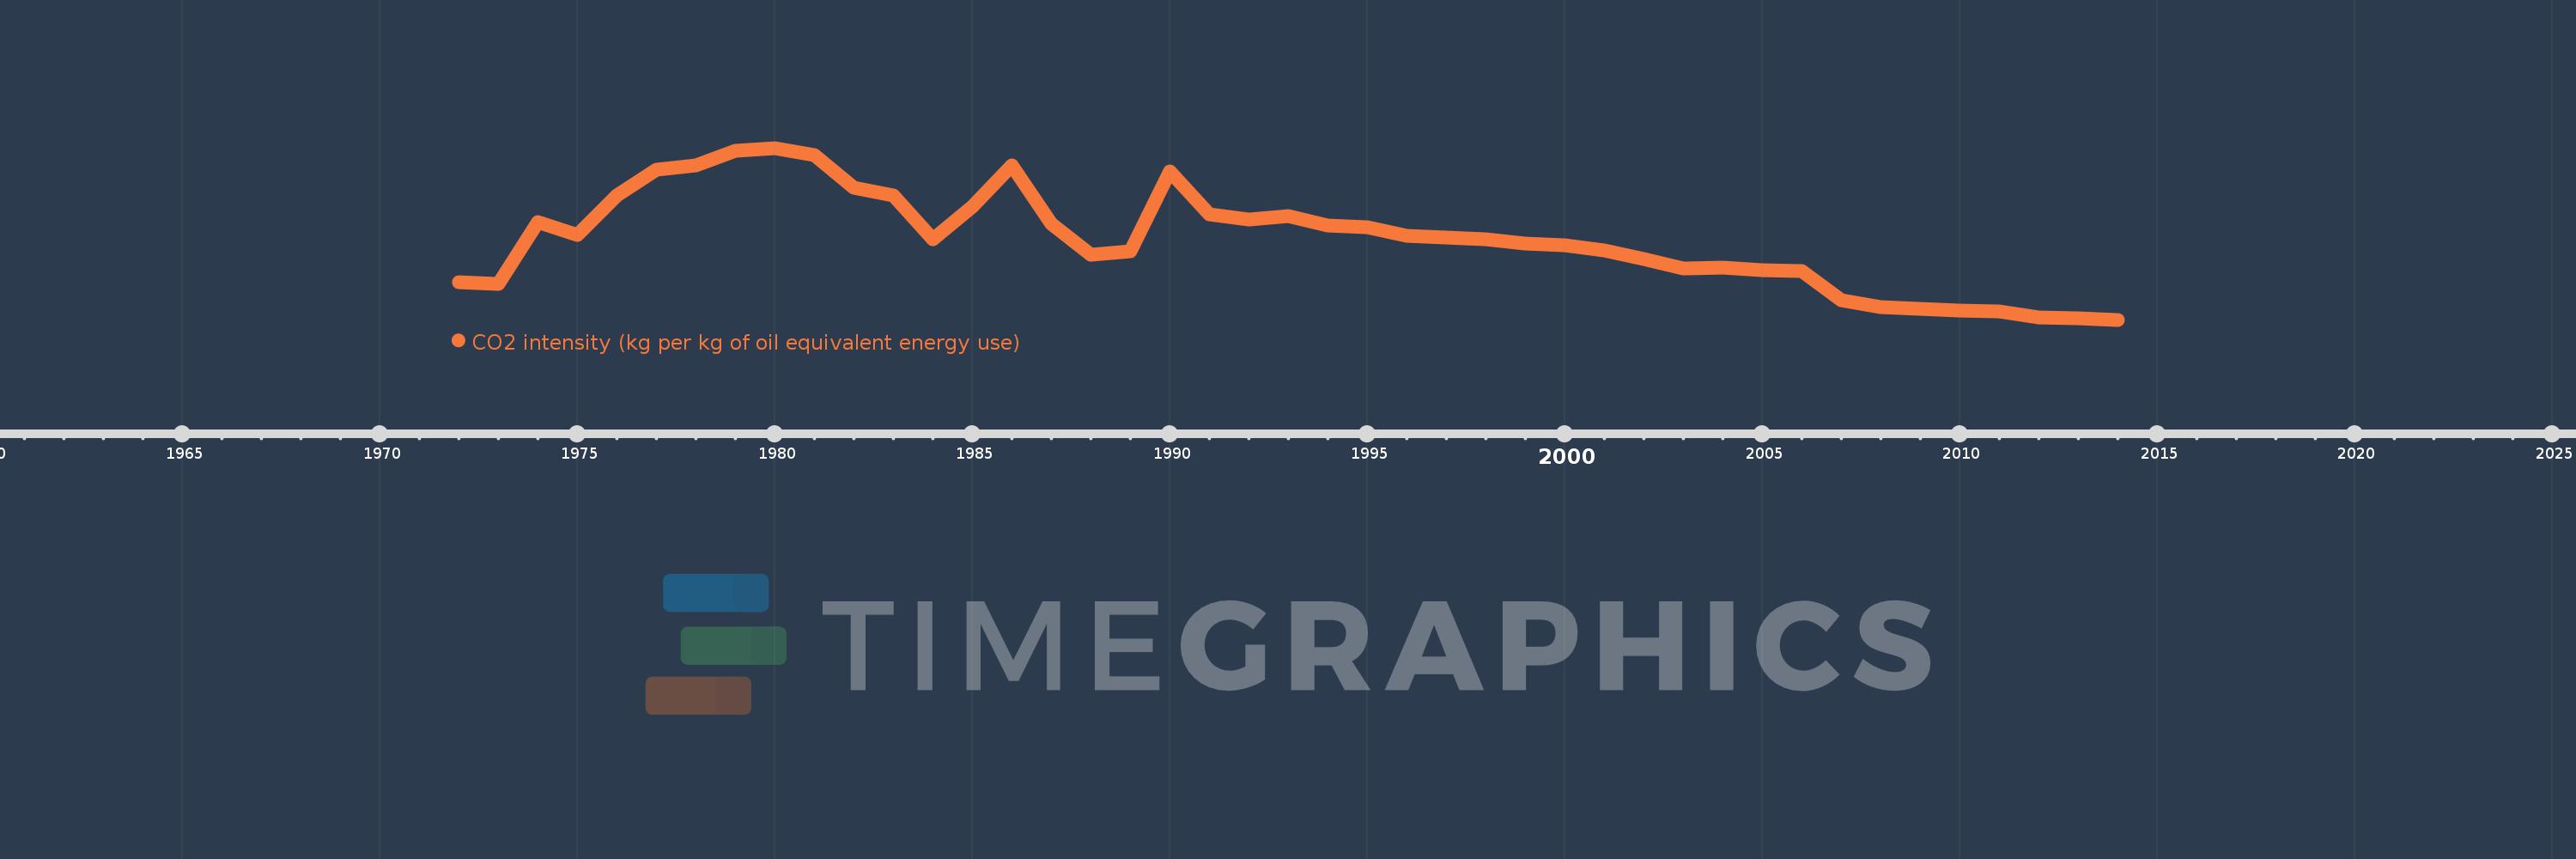
CO2 intensity (kg per kg of oil equivalent energy use)
2014,2013,2012,2011,2010,2009,2008,2007,2006,2005,2004,2003,2002,2001,2000,1999,1998,1997,1996,1995,1994,1993,1992,1991,1990,1989,1988,1987,1986,1985,1984,1983,1982,1981,1980,1979,1978,1977,1976,1975,1974,1973,1972
Queste statistiche in altri paesi:
AlbaniaAlgeriaAngolaAntigua and BarbudaArab WorldArgentinaArmeniaAustraliaAustriaAzerbaijanBahamas, TheBahrainBangladeshBarbadosBelarusBelgiumBelizeBeninBhutanBoliviaBosnia and HerzegovinaBotswanaBrazilBrunei DarussalamBulgariaCabo VerdeCambodiaCameroonCanadaCaribbean small statesCentral Europe and the BalticsChileChinaColombiaComorosCongo, Dem. Rep.Congo, Rep.Costa RicaCote d'IvoireCroatiaCubaCuracaoCyprusCzech RepublicDenmarkDjiboutiDominicaDominican RepublicEarly-demographic dividendEast Asia & PacificEast Asia & Pacific (excluding high income)East Asia & Pacific (IDA & IBRD countries)EcuadorEgypt, Arab Rep.El SalvadorEquatorial GuineaEritreaEstoniaEthiopiaEuro areaEurope & Central AsiaEurope & Central Asia (excluding high income)Europe & Central Asia (IDA & IBRD countries)European UnionFijiFinlandFragile and conflict affected situationsFranceGabonGambia, TheGeorgiaGermanyGhanaGibraltarGreeceGrenadaGuatemalaGuinea-BissauGuyanaHaitiHeavily indebted poor countries (HIPC)High incomeHondurasHong Kong SAR, ChinaHungaryIBRD onlyIcelandIDA & IBRD totalIDA blendIDA onlyIDA totalIndiaIndonesiaIran, Islamic Rep.IraqIrelandIsraelItalyJamaicaJapanJordanKazakhstanKenyaKiribatiKorea, Dem. People’s Rep.Korea, Rep.KuwaitKyrgyz RepublicLate-demographic dividendLatin America & Caribbean Latin America & Caribbean (excluding high income)Latin America & the Caribbean (IDA & IBRD countries)LatviaLeast developed countries: UN classificationLebanonLesothoLibyaLithuaniaLow & middle incomeLow incomeLower middle incomeLuxembourgMacedonia, FYRMalaysiaMaldivesMaltaMarshall IslandsMauritiusMexicoMiddle East & North AfricaMiddle East & North Africa (excluding high income)Middle East & North Africa (IDA & IBRD countries)Middle incomeMoldovaMongoliaMontenegroMoroccoMozambiqueMyanmarNamibiaNepalNetherlandsNew ZealandNicaraguaNigerNigeriaNorth AmericaNorwayOECD membersOmanOther small statesPacific island small statesPakistanPalauPanamaParaguayPeruPhilippinesPolandPortugalPost-demographic dividendPre-demographic dividendQatarRomaniaRussian FederationSamoaSao Tome and PrincipeSaudi ArabiaSenegalSerbiaSeychellesSingaporeSlovak RepublicSloveniaSmall statesSolomon IslandsSouth AfricaSouth AsiaSouth Asia (IDA & IBRD)South SudanSpainSri LankaSt. Kitts and NevisSt. LuciaSt. Vincent and the GrenadinesSub-Saharan Africa Sub-Saharan Africa (excluding high income)Sub-Saharan Africa (IDA & IBRD countries)SudanSurinameSwazilandSwedenSwitzerlandSyrian Arab RepublicTajikistanTanzaniaThailandTimor-LesteTogoTongaTrinidad and TobagoTunisiaTurkeyTurkmenistanUkraineUnited Arab EmiratesUnited KingdomUnited StatesUpper middle incomeUruguayUzbekistanVanuatuVenezuela, RBVietnamWorldYemen, Rep.ZambiaZimbabwe Linea del tempo:
Questa scala temporale mostra un grafico dal 1972 anno al 2014 anno. Gabon. I dati fino ad 1971 anno non disponibili. Il numero di osservazioni attuali secondo i date: 43.
La fonte (nome):
Indicatori dello sviluppo mondiale
La fonte (organizzazione):
Carbon Dioxide Information Analysis Center, Environmental Sciences Division, Oak Ridge National Laboratory, Tennessee, United States.
Categorie:
Climate Change, Environment
sono stati aggiornati
23 apr 2017 anni
Indicatori delle variazioni dei valori per anni
Minima:
2.008
1 gen 2014 anni
Massimo:
4.95
1 gen 1980 anni
Alla data di osservazione
Valore
Variazione assoluta
La variazione rispetto al valore precedente
1 gen 1972 anni
2.658
+2.658
0.0%
1 gen 1973 anni
2.617
-0.041
-1.56%
1 gen 1974 anni
3.684
+1.068
40.8%
1 gen 1975 anni
3.465
-0.219
-5.94%
1 gen 1976 anni
4.134
+0.668
19.29%
1 gen 1977 anni
4.584
+0.45
10.88%
1 gen 1978 anni
4.649
+0.066
1.43%
1 gen 1979 anni
4.905
+0.256
5.51%
1 gen 1980 anni
4.95
+0.045
0.92%
1 gen 1981 anni
4.827
-0.123
-2.48%
1 gen 1982 anni
4.264
-0.563
-11.67%
1 gen 1983 anni
4.131
-0.133
-3.13%
1 gen 1984 anni
3.38
-0.75
-18.17%
1 gen 1985 anni
3.948
+0.567
16.78%
1 gen 1986 anni
4.646
+0.698
17.69%
1 gen 1987 anni
3.656
-0.99
-21.3%
1 gen 1988 anni
3.12
-0.537
-14.67%
1 gen 1989 anni
3.179
+0.059
1.9%
1 gen 1990 anni
4.546
+1.367
42.99%
1 gen 1991 anni
3.809
-0.737
-16.22%
1 gen 1992 anni
3.718
-0.09
-2.37%
1 gen 1993 anni
3.782
+0.064
1.72%
1 gen 1994 anni
3.617
-0.165
-4.36%
1 gen 1995 anni
3.589
-0.028
-0.78%
1 gen 1996 anni
3.448
-0.141
-3.93%
1 gen 1997 anni
3.419
-0.029
-0.84%
1 gen 1998 anni
3.393
-0.026
-0.76%
1 gen 1999 anni
3.311
-0.081
-2.4%
1 gen 2000 anni
3.284
-0.027
-0.82%
1 gen 2001 anni
3.192
-0.092
-2.81%
1 gen 2002 anni
3.041
-0.151
-4.73%
1 gen 2003 anni
2.885
-0.155
-5.11%
1 gen 2004 anni
2.902
+0.017
0.6%
1 gen 2005 anni
2.859
-0.043
-1.49%
1 gen 2006 anni
2.837
-0.023
-0.79%
1 gen 2007 anni
2.344
-0.492
-17.36%
1 gen 2008 anni
2.23
-0.114
-4.88%
1 gen 2009 anni
2.192
-0.038
-1.7%
1 gen 2010 anni
2.169
-0.023
-1.05%
1 gen 2011 anni
2.146
-0.023
-1.04%
1 gen 2012 anni
2.054
-0.093
-4.32%
1 gen 2013 anni
2.026
-0.028
-1.34%
1 gen 2014 anni
2.008
-0.018
-0.87%
Classificazione dei paesi secondo i statistiche attuali per anni


Commenti: