29
/it/
it
AIzaSyAYiBZKx7MnpbEhh9jyipgxe19OcubqV5w
April 1, 2024
38421
IDA blend
IDB
false
2
1
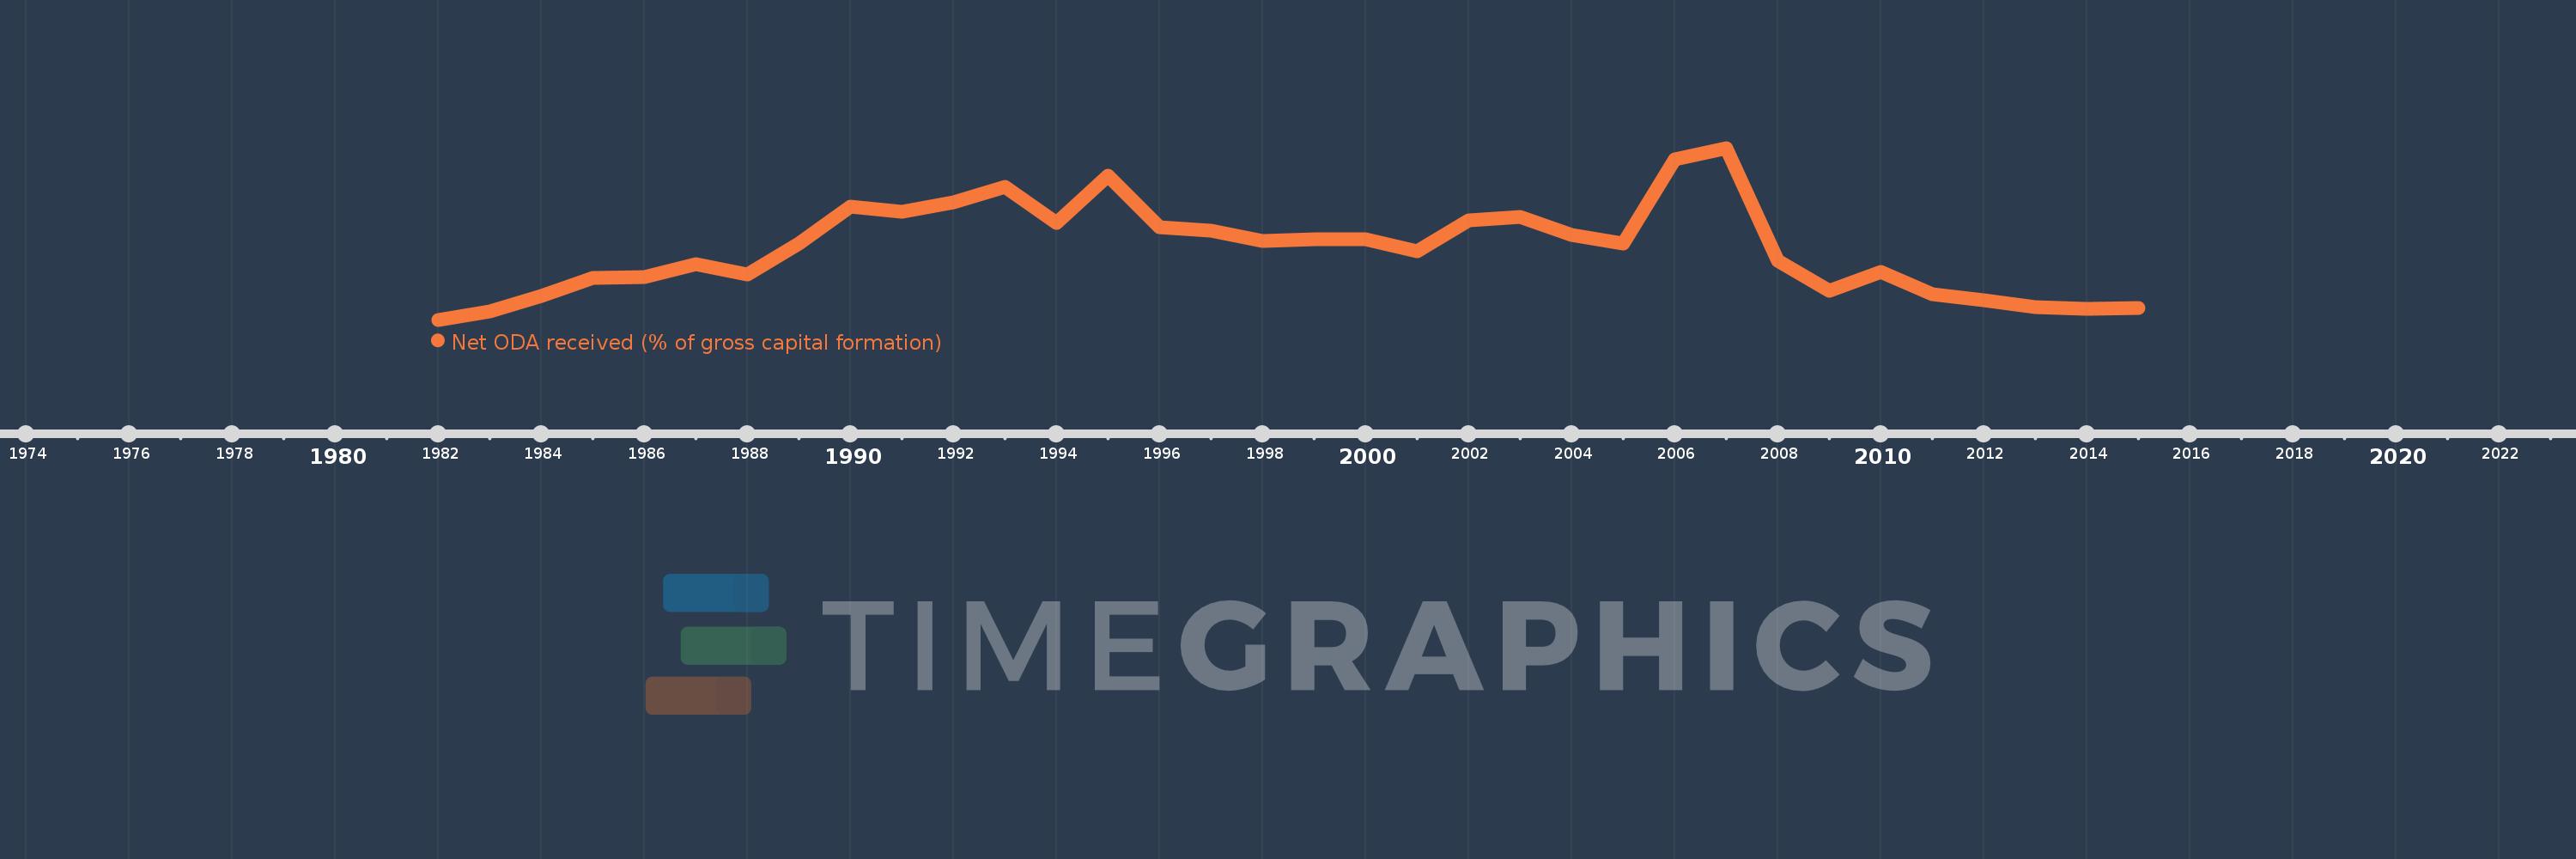
Net ODA received (% of gross capital formation)
2015,2014,2013,2012,2011,2010,2009,2008,2007,2006,2005,2004,2003,2002,2001,2000,1999,1998,1997,1996,1995,1994,1993,1992,1991,1990,1989,1988,1987,1986,1985,1984,1983,1982
Queste statistiche in altri paesi:
AfghanistanAlbaniaAlgeriaAngolaAntigua and BarbudaArab WorldArgentinaArmeniaArubaAzerbaijanBahamas, TheBahrainBangladeshBarbadosBelarusBelizeBeninBhutanBoliviaBosnia and HerzegovinaBotswanaBrazilBrunei DarussalamBurkina FasoBurundiCabo VerdeCambodiaCameroonCaribbean small statesCentral African RepublicCentral Europe and the BalticsChadChileChinaColombiaComorosCongo, Dem. Rep.Congo, Rep.Costa RicaCote d'IvoireCroatiaCubaCyprusDjiboutiDominicaDominican RepublicEast Asia & PacificEast Asia & Pacific (excluding high income)East Asia & Pacific (IDA & IBRD countries)EcuadorEgypt, Arab Rep.El SalvadorEquatorial GuineaEritreaEthiopiaEuro areaEurope & Central AsiaEurope & Central Asia (excluding high income)Europe & Central Asia (IDA & IBRD countries)European UnionFijiFragile and conflict affected situationsGabonGambia, TheGeorgiaGhanaGrenadaGuatemalaGuineaGuinea-BissauGuyanaHaitiHeavily indebted poor countries (HIPC)High incomeHondurasHong Kong SAR, ChinaIBRD onlyIDA & IBRD totalIDA blendIDA onlyIDA totalIndiaIndonesiaIran, Islamic Rep.IraqIsraelJamaicaJordanKazakhstanKenyaKiribatiKorea, Rep.KosovoKuwaitKyrgyz RepublicLao PDRLatin America & Caribbean Latin America & Caribbean (excluding high income)Latin America & the Caribbean (IDA & IBRD countries)Least developed countries: UN classificationLebanonLesothoLiberiaLibyaLow & middle incomeLow incomeLower middle incomeMacao SAR, ChinaMacedonia, FYRMadagascarMalawiMalaysiaMaldivesMaliMaltaMauritaniaMauritiusMexicoMiddle East & North AfricaMiddle East & North Africa (excluding high income)Middle East & North Africa (IDA & IBRD countries)Middle incomeMoldovaMongoliaMontenegroMoroccoMozambiqueNamibiaNepalNew CaledoniaNicaraguaNigerNigeriaNorth AmericaOECD membersOmanOther small statesPakistanPanamaPapua New GuineaParaguayPeruPhilippinesQatarRwandaSaudi ArabiaSenegalSerbiaSeychellesSierra LeoneSingaporeSloveniaSmall statesSolomon IslandsSouth AfricaSouth AsiaSouth Asia (IDA & IBRD)South SudanSri LankaSt. Kitts and NevisSt. LuciaSt. Vincent and the GrenadinesSub-Saharan Africa Sub-Saharan Africa (excluding high income)Sub-Saharan Africa (IDA & IBRD countries)SudanSurinameSwazilandSyrian Arab RepublicTajikistanTanzaniaThailandTimor-LesteTogoTongaTrinidad and TobagoTunisiaTurkeyTurkmenistanUgandaUkraineUpper middle incomeUruguayUzbekistanVanuatuVenezuela, RBVietnamWest Bank and GazaWorldYemen, Rep.ZambiaZimbabwe Linea del tempo:
Questa scala temporale mostra un grafico dal 1982 anno al 2015 anno. IDA blend. I dati fino ad 1981 anno non disponibili. Il numero di osservazioni attuali secondo i date: 34.
La fonte (nome):
Indicatori dello sviluppo mondiale
La fonte (organizzazione):
Development Assistance Committee of the Organisation for Economic Co-operation and Development, Geographical Distribution of Financial Flows to Developing Countries, Development Co-operation Report, and International Development Statistics database. Data are available online at: www.oecd.org/dac/stats/idsonline. World Bank gross capital formation estimates are used for the denominator.
Categorie:
Aid Effectiveness
sono stati aggiornati
23 apr 2017 anni
Indicatori delle variazioni dei valori per anni
Minima:
4.898
1 gen 1982 anni
Massimo:
24.538
1 gen 2007 anni
Alla data di osservazione
Valore
Variazione assoluta
La variazione rispetto al valore precedente
1 gen 1982 anni
4.898
+4.898
0.0%
1 gen 1983 anni
5.856
+0.958
19.57%
1 gen 1984 anni
7.593
+1.737
29.66%
1 gen 1985 anni
9.683
+2.09
27.52%
1 gen 1986 anni
9.733
+0.051
0.52%
1 gen 1987 anni
11.226
+1.493
15.34%
1 gen 1988 anni
10.106
-1.121
-9.98%
1 gen 1989 anni
13.587
+3.481
34.45%
1 gen 1990 anni
17.804
+4.216
31.03%
1 gen 1991 anni
17.217
-0.587
-3.3%
1 gen 1992 anni
18.324
+1.107
6.43%
1 gen 1993 anni
20.071
+1.747
9.53%
1 gen 1994 anni
15.957
-4.114
-20.5%
1 gen 1995 anni
21.401
+5.444
34.12%
1 gen 1996 anni
15.439
-5.961
-27.86%
1 gen 1997 anni
15.13
-0.309
-2.0%
1 gen 1998 anni
13.938
-1.192
-7.88%
1 gen 1999 anni
14.068
+0.13
0.93%
1 gen 2000 anni
14.147
+0.079
0.56%
1 gen 2001 anni
12.715
-1.431
-10.12%
1 gen 2002 anni
16.26
+3.545
27.88%
1 gen 2003 anni
16.659
+0.399
2.45%
1 gen 2004 anni
14.638
-2.021
-12.13%
1 gen 2005 anni
13.609
-1.029
-7.03%
1 gen 2006 anni
23.233
+9.624
70.72%
1 gen 2007 anni
24.538
+1.305
5.62%
1 gen 2008 anni
11.637
-12.901
-52.58%
1 gen 2009 anni
8.183
-3.454
-29.68%
1 gen 2010 anni
10.413
+2.231
27.26%
1 gen 2011 anni
7.8
-2.613
-25.09%
1 gen 2012 anni
7.082
-0.719
-9.21%
1 gen 2013 anni
6.295
-0.787
-11.11%
1 gen 2014 anni
6.138
-0.156
-2.48%
1 gen 2015 anni
6.212
+0.073
1.19%
Classificazione dei paesi secondo i statistiche attuali per anni


Commenti: