29
/it/
it
AIzaSyAYiBZKx7MnpbEhh9jyipgxe19OcubqV5w
April 1, 2024
126584
El Salvador
SLV
true
2
1
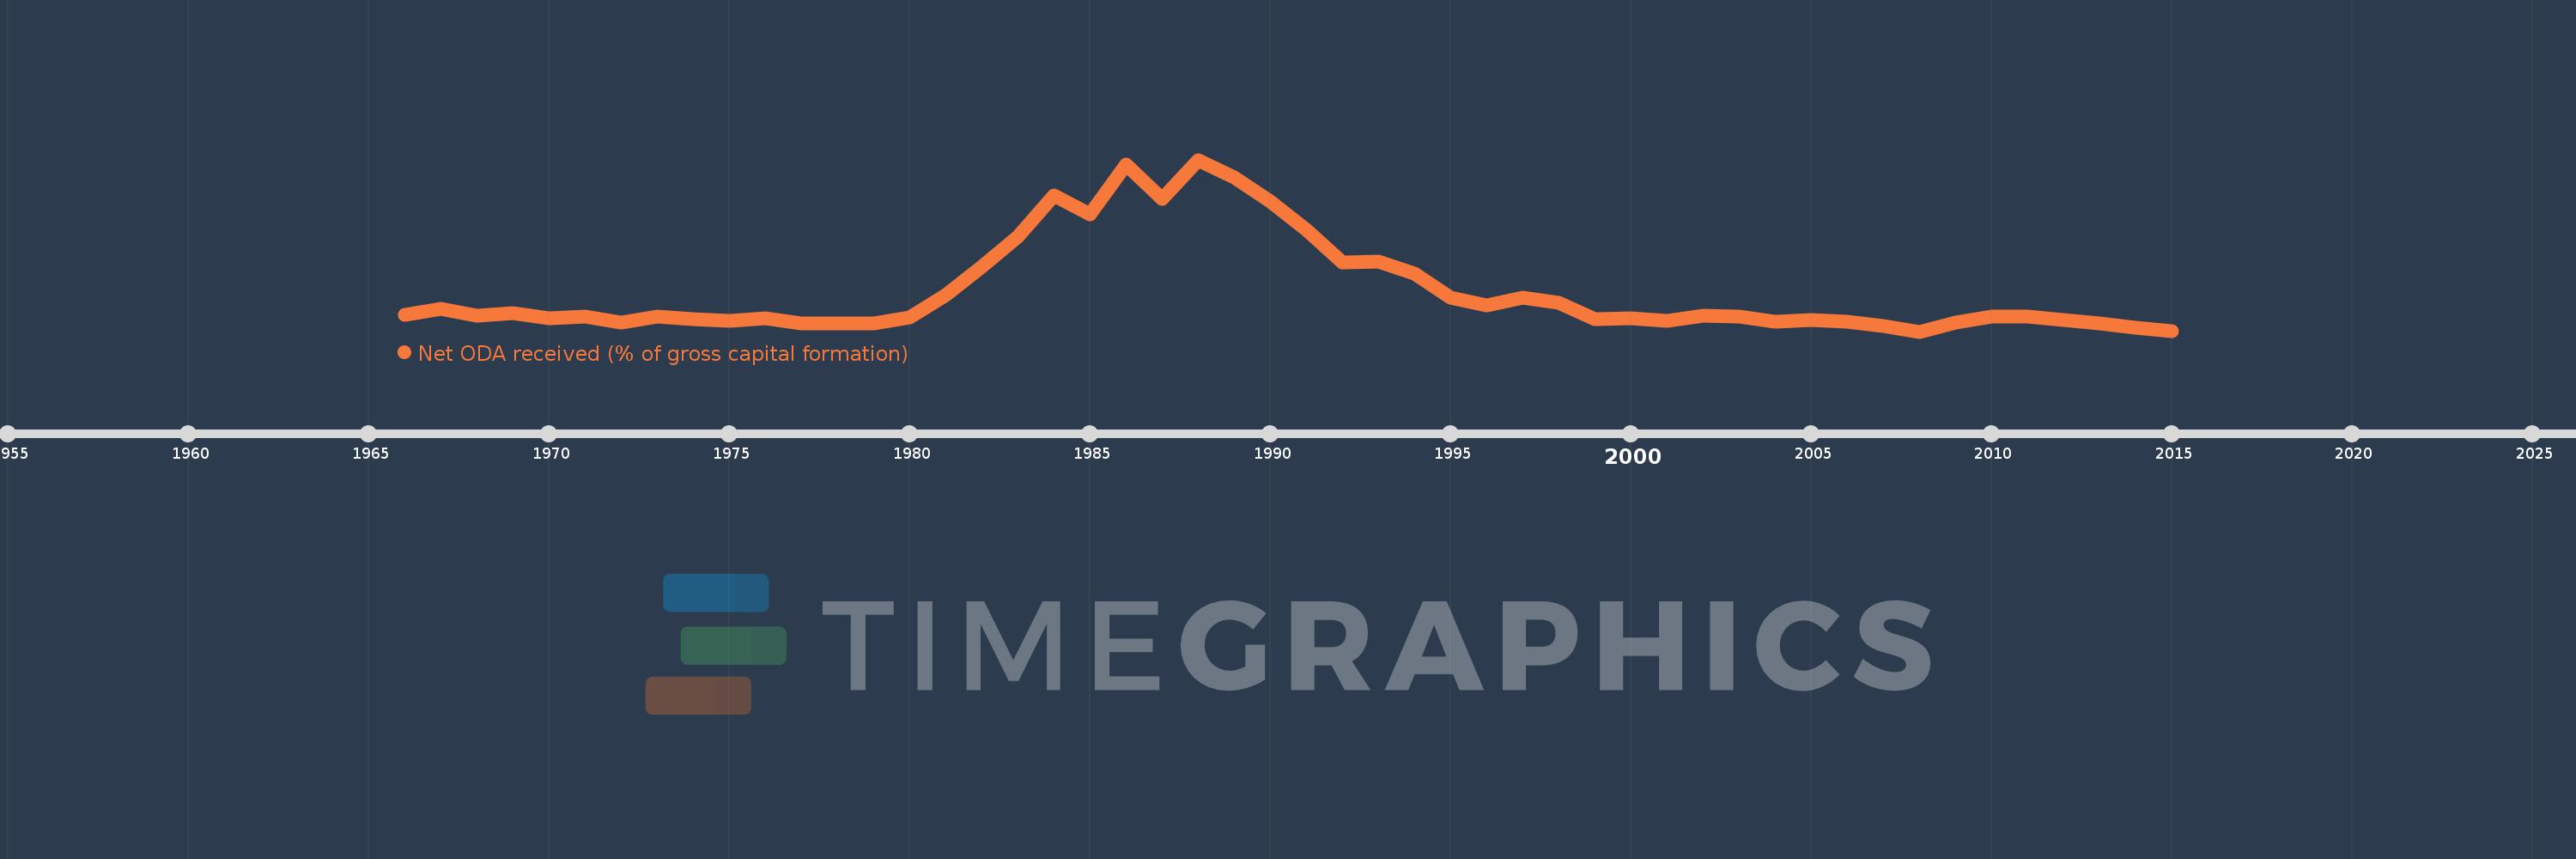
Net ODA received (% of gross capital formation)
2015,2014,2013,2012,2011,2010,2009,2008,2007,2006,2005,2004,2003,2002,2001,2000,1999,1998,1997,1996,1995,1994,1993,1992,1991,1990,1989,1988,1987,1986,1985,1984,1983,1982,1981,1980,1979,1978,1977,1976,1975,1974,1973,1972,1971,1970,1969,1968,1967,1966
Queste statistiche in altri paesi:
AfghanistanAlbaniaAlgeriaAngolaAntigua and BarbudaArab WorldArgentinaArmeniaArubaAzerbaijanBahamas, TheBahrainBangladeshBarbadosBelarusBelizeBeninBhutanBoliviaBosnia and HerzegovinaBotswanaBrazilBrunei DarussalamBurkina FasoBurundiCabo VerdeCambodiaCameroonCaribbean small statesCentral African RepublicCentral Europe and the BalticsChadChileChinaColombiaComorosCongo, Dem. Rep.Congo, Rep.Costa RicaCote d'IvoireCroatiaCubaCyprusDjiboutiDominicaDominican RepublicEast Asia & PacificEast Asia & Pacific (excluding high income)East Asia & Pacific (IDA & IBRD countries)EcuadorEgypt, Arab Rep.El SalvadorEquatorial GuineaEritreaEthiopiaEuro areaEurope & Central AsiaEurope & Central Asia (excluding high income)Europe & Central Asia (IDA & IBRD countries)European UnionFijiFragile and conflict affected situationsGabonGambia, TheGeorgiaGhanaGrenadaGuatemalaGuineaGuinea-BissauGuyanaHaitiHeavily indebted poor countries (HIPC)High incomeHondurasHong Kong SAR, ChinaIBRD onlyIDA & IBRD totalIDA blendIDA onlyIDA totalIndiaIndonesiaIran, Islamic Rep.IraqIsraelJamaicaJordanKazakhstanKenyaKiribatiKorea, Rep.KosovoKuwaitKyrgyz RepublicLao PDRLatin America & Caribbean Latin America & Caribbean (excluding high income)Latin America & the Caribbean (IDA & IBRD countries)Least developed countries: UN classificationLebanonLesothoLiberiaLibyaLow & middle incomeLow incomeLower middle incomeMacao SAR, ChinaMacedonia, FYRMadagascarMalawiMalaysiaMaldivesMaliMaltaMauritaniaMauritiusMexicoMiddle East & North AfricaMiddle East & North Africa (excluding high income)Middle East & North Africa (IDA & IBRD countries)Middle incomeMoldovaMongoliaMontenegroMoroccoMozambiqueNamibiaNepalNew CaledoniaNicaraguaNigerNigeriaNorth AmericaOECD membersOmanOther small statesPakistanPanamaPapua New GuineaParaguayPeruPhilippinesQatarRwandaSaudi ArabiaSenegalSerbiaSeychellesSierra LeoneSingaporeSloveniaSmall statesSolomon IslandsSouth AfricaSouth AsiaSouth Asia (IDA & IBRD)South SudanSri LankaSt. Kitts and NevisSt. LuciaSt. Vincent and the GrenadinesSub-Saharan Africa Sub-Saharan Africa (excluding high income)Sub-Saharan Africa (IDA & IBRD countries)SudanSurinameSwazilandSyrian Arab RepublicTajikistanTanzaniaThailandTimor-LesteTogoTongaTrinidad and TobagoTunisiaTurkeyTurkmenistanUgandaUkraineUpper middle incomeUruguayUzbekistanVanuatuVenezuela, RBVietnamWest Bank and GazaWorldYemen, Rep.ZambiaZimbabwe Linea del tempo:
Questa scala temporale mostra un grafico dal 1966 anno al 2015 anno. El Salvador. I dati fino ad 1965 anno non disponibili. Il numero di osservazioni attuali secondo i date: 50.
La fonte (nome):
Indicatori dello sviluppo mondiale
La fonte (organizzazione):
Development Assistance Committee of the Organisation for Economic Co-operation and Development, Geographical Distribution of Financial Flows to Developing Countries, Development Co-operation Report, and International Development Statistics database. Data are available online at: www.oecd.org/dac/stats/idsonline. World Bank gross capital formation estimates are used for the denominator.
Categorie:
Aid Effectiveness
sono stati aggiornati
23 apr 2017 anni
Indicatori delle variazioni dei valori per anni
Minima:
2.686
1 gen 2008 anni
Massimo:
86.032
1 gen 1988 anni
Alla data di osservazione
Valore
Variazione assoluta
La variazione rispetto al valore precedente
1 gen 1966 anni
10.853
+10.853
0.0%
1 gen 1967 anni
13.532
+2.679
24.69%
1 gen 1968 anni
10.555
-2.977
-22.0%
1 gen 1969 anni
11.68
+1.126
10.66%
1 gen 1970 anni
9.23
-2.451
-20.98%
1 gen 1971 anni
9.895
+0.665
7.21%
1 gen 1972 anni
6.888
-3.007
-30.39%
1 gen 1973 anni
10.14
+3.252
47.21%
1 gen 1974 anni
8.648
-1.492
-14.71%
1 gen 1975 anni
7.8
-0.848
-9.81%
1 gen 1976 anni
8.956
+1.156
14.82%
1 gen 1977 anni
6.506
-2.45
-27.36%
1 gen 1978 anni
6.546
+0.04
0.62%
1 gen 1979 anni
6.759
+0.213
3.26%
1 gen 1980 anni
9.48
+2.72
40.24%
1 gen 1981 anni
20.312
+10.832
114.27%
1 gen 1982 anni
34.15
+13.838
68.13%
1 gen 1983 anni
48.631
+14.481
42.4%
1 gen 1984 anni
68.662
+20.03
41.19%
1 gen 1985 anni
59.609
-9.053
-13.18%
1 gen 1986 anni
83.708
+24.099
40.43%
1 gen 1987 anni
67.254
-16.454
-19.66%
1 gen 1988 anni
86.032
+18.778
27.92%
1 gen 1989 anni
77.459
-8.573
-9.96%
1 gen 1990 anni
65.709
-11.751
-15.17%
1 gen 1991 anni
52.194
-13.515
-20.57%
1 gen 1992 anni
36.041
-16.154
-30.95%
1 gen 1993 anni
36.592
+0.551
1.53%
1 gen 1994 anni
30.988
-5.605
-15.32%
1 gen 1995 anni
19.163
-11.824
-38.16%
1 gen 1996 anni
15.542
-3.622
-18.9%
1 gen 1997 anni
19.199
+3.657
23.53%
1 gen 1998 anni
16.549
-2.65
-13.8%
1 gen 1999 anni
8.584
-7.965
-48.13%
1 gen 2000 anni
8.942
+0.358
4.17%
1 gen 2001 anni
8.082
-0.861
-9.62%
1 gen 2002 anni
10.315
+2.233
27.64%
1 gen 2003 anni
9.951
-0.364
-3.53%
1 gen 2004 anni
7.52
-2.43
-24.42%
1 gen 2005 anni
8.454
+0.934
12.42%
1 gen 2006 anni
7.437
-1.017
-12.03%
1 gen 2007 anni
5.218
-2.219
-29.83%
1 gen 2008 anni
2.686
-2.533
-48.54%
1 gen 2009 anni
7.163
+4.477
166.72%
1 gen 2010 anni
9.942
+2.779
38.8%
1 gen 2011 anni
9.828
-0.114
-1.15%
1 gen 2012 anni
8.358
-1.47
-14.96%
1 gen 2013 anni
6.543
-1.814
-21.71%
1 gen 2014 anni
4.642
-1.901
-29.06%
1 gen 2015 anni
2.869
-1.773
-38.2%
Classificazione dei paesi secondo i statistiche attuali per anni


Commenti: