29
/it/
it
AIzaSyAYiBZKx7MnpbEhh9jyipgxe19OcubqV5w
April 1, 2024
157677
Iran, Islamic Rep.
IRN
true
2
1
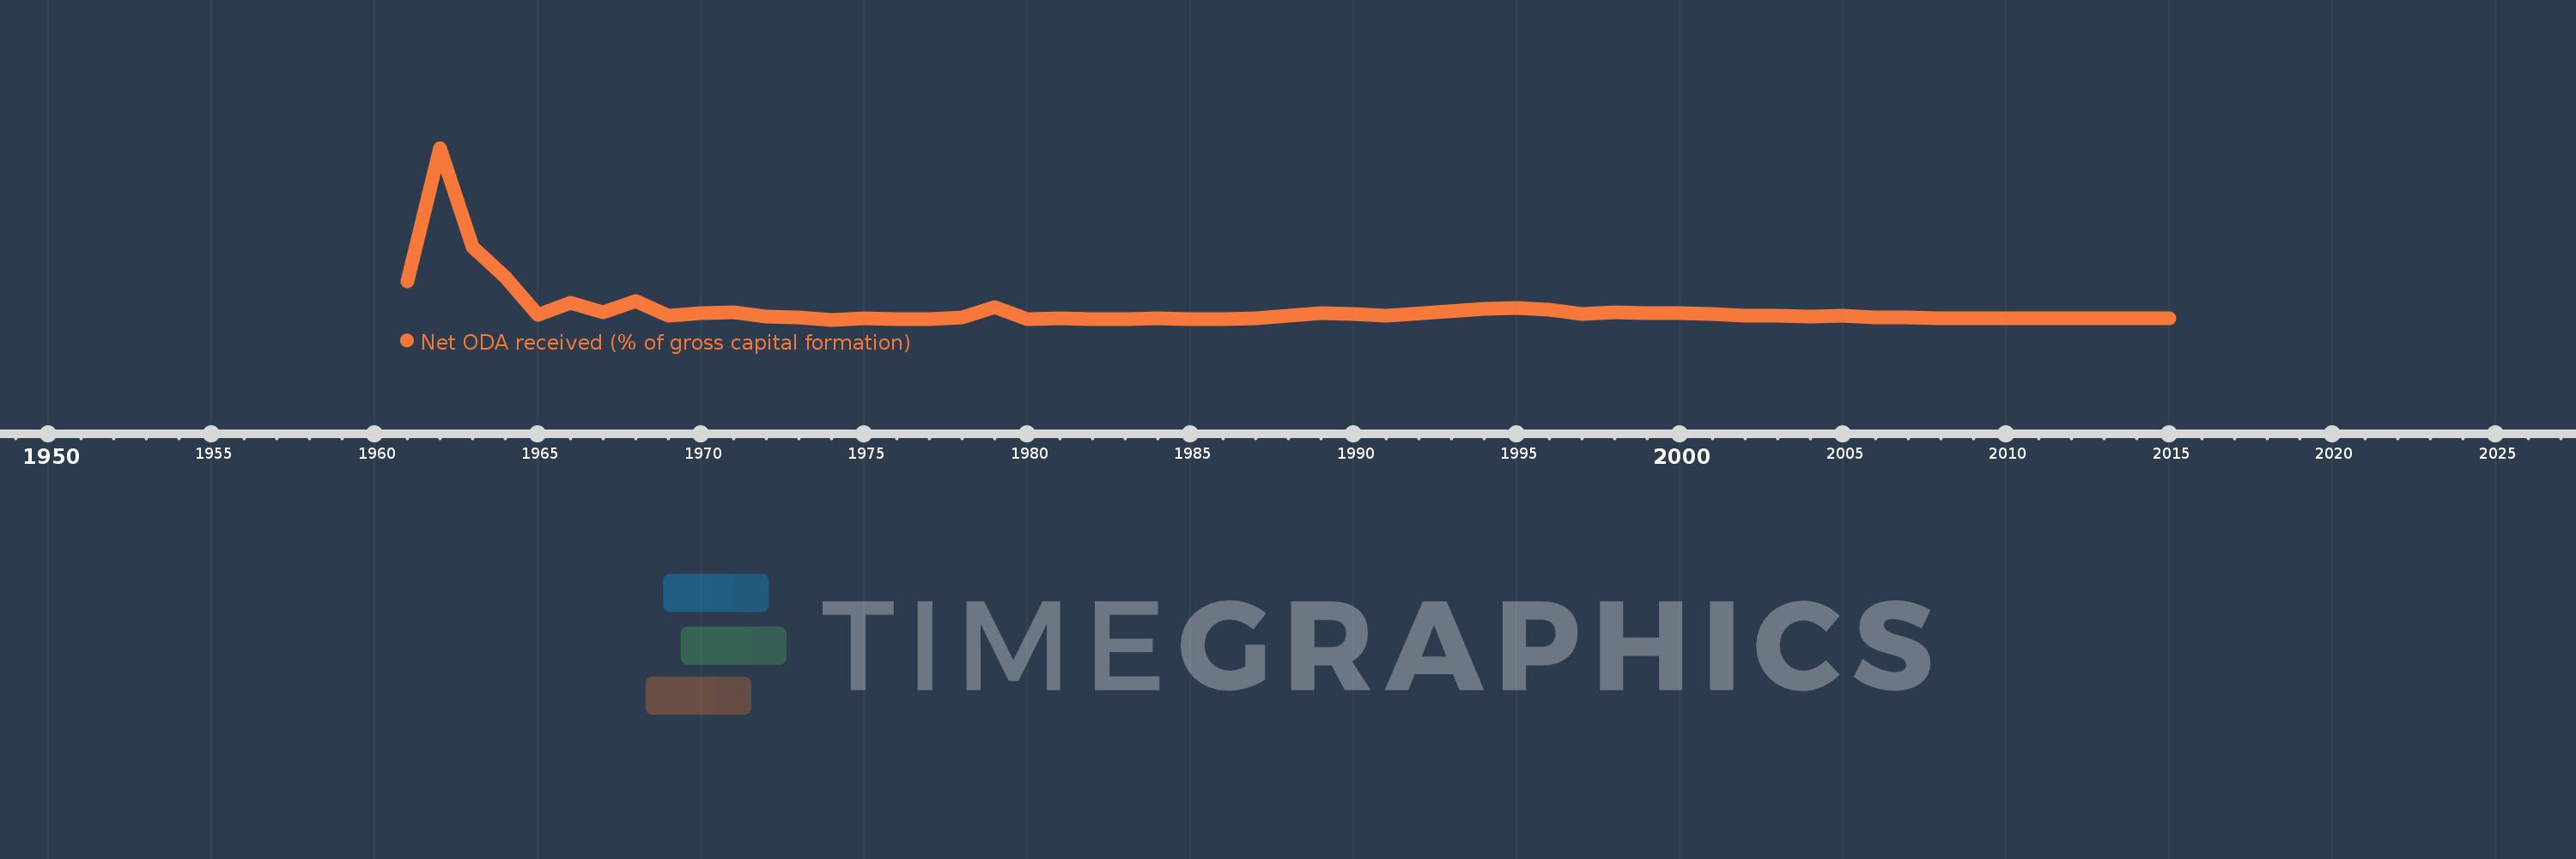
Net ODA received (% of gross capital formation)
2015,2014,2013,2012,2011,2010,2009,2008,2007,2006,2005,2004,2003,2002,2001,2000,1999,1998,1997,1996,1995,1994,1991,1990,1989,1988,1987,1986,1985,1984,1983,1982,1981,1980,1979,1978,1977,1976,1975,1974,1973,1972,1971,1970,1969,1968,1967,1966,1965,1964,1963,1962,1961
Queste statistiche in altri paesi:
AfghanistanAlbaniaAlgeriaAngolaAntigua and BarbudaArab WorldArgentinaArmeniaArubaAzerbaijanBahamas, TheBahrainBangladeshBarbadosBelarusBelizeBeninBhutanBoliviaBosnia and HerzegovinaBotswanaBrazilBrunei DarussalamBurkina FasoBurundiCabo VerdeCambodiaCameroonCaribbean small statesCentral African RepublicCentral Europe and the BalticsChadChileChinaColombiaComorosCongo, Dem. Rep.Congo, Rep.Costa RicaCote d'IvoireCroatiaCubaCyprusDjiboutiDominicaDominican RepublicEast Asia & PacificEast Asia & Pacific (excluding high income)East Asia & Pacific (IDA & IBRD countries)EcuadorEgypt, Arab Rep.El SalvadorEquatorial GuineaEritreaEthiopiaEuro areaEurope & Central AsiaEurope & Central Asia (excluding high income)Europe & Central Asia (IDA & IBRD countries)European UnionFijiFragile and conflict affected situationsGabonGambia, TheGeorgiaGhanaGrenadaGuatemalaGuineaGuinea-BissauGuyanaHaitiHeavily indebted poor countries (HIPC)High incomeHondurasHong Kong SAR, ChinaIBRD onlyIDA & IBRD totalIDA blendIDA onlyIDA totalIndiaIndonesiaIran, Islamic Rep.IraqIsraelJamaicaJordanKazakhstanKenyaKiribatiKorea, Rep.KosovoKuwaitKyrgyz RepublicLao PDRLatin America & Caribbean Latin America & Caribbean (excluding high income)Latin America & the Caribbean (IDA & IBRD countries)Least developed countries: UN classificationLebanonLesothoLiberiaLibyaLow & middle incomeLow incomeLower middle incomeMacao SAR, ChinaMacedonia, FYRMadagascarMalawiMalaysiaMaldivesMaliMaltaMauritaniaMauritiusMexicoMiddle East & North AfricaMiddle East & North Africa (excluding high income)Middle East & North Africa (IDA & IBRD countries)Middle incomeMoldovaMongoliaMontenegroMoroccoMozambiqueNamibiaNepalNew CaledoniaNicaraguaNigerNigeriaNorth AmericaOECD membersOmanOther small statesPakistanPanamaPapua New GuineaParaguayPeruPhilippinesQatarRwandaSaudi ArabiaSenegalSerbiaSeychellesSierra LeoneSingaporeSloveniaSmall statesSolomon IslandsSouth AfricaSouth AsiaSouth Asia (IDA & IBRD)South SudanSri LankaSt. Kitts and NevisSt. LuciaSt. Vincent and the GrenadinesSub-Saharan Africa Sub-Saharan Africa (excluding high income)Sub-Saharan Africa (IDA & IBRD countries)SudanSurinameSwazilandSyrian Arab RepublicTajikistanTanzaniaThailandTimor-LesteTogoTongaTrinidad and TobagoTunisiaTurkeyTurkmenistanUgandaUkraineUpper middle incomeUruguayUzbekistanVanuatuVenezuela, RBVietnamWest Bank and GazaWorldYemen, Rep.ZambiaZimbabwe Linea del tempo:
Questa scala temporale mostra un grafico dal 1961 anno al 2015 anno. Iran, Islamic Rep.. I dati fino ad 1960 anno non disponibili. Il numero di osservazioni attuali secondo i date: 53.
La fonte (nome):
Indicatori dello sviluppo mondiale
La fonte (organizzazione):
Development Assistance Committee of the Organisation for Economic Co-operation and Development, Geographical Distribution of Financial Flows to Developing Countries, Development Co-operation Report, and International Development Statistics database. Data are available online at: www.oecd.org/dac/stats/idsonline. World Bank gross capital formation estimates are used for the denominator.
Categorie:
Aid Effectiveness
sono stati aggiornati
23 apr 2017 anni
Indicatori delle variazioni dei valori per anni
Minima:
-0.039
1 gen 1974 anni
Massimo:
11.644
1 gen 1962 anni
Alla data di osservazione
Valore
Variazione assoluta
La variazione rispetto al valore precedente
1 gen 1961 anni
2.569
+2.569
0.0%
1 gen 1962 anni
11.644
+9.075
353.24%
1 gen 1963 anni
4.92
-6.724
-57.75%
1 gen 1964 anni
2.884
-2.036
-41.38%
1 gen 1965 anni
0.298
-2.586
-89.66%
1 gen 1966 anni
1.085
+0.787
263.78%
1 gen 1967 anni
0.488
-0.597
-55.02%
1 gen 1968 anni
1.245
+0.757
155.17%
1 gen 1969 anni
0.235
-1.011
-81.15%
1 gen 1970 anni
0.436
+0.201
85.56%
1 gen 1971 anni
0.47
+0.034
7.84%
1 gen 1972 anni
0.158
-0.312
-66.37%
1 gen 1973 anni
0.129
-0.029
-18.29%
1 gen 1974 anni
-0.039
-0.168
-130.5%
1 gen 1975 anni
0.063
+0.103
-260.83%
1 gen 1976 anni
0.007
-0.056
-88.8%
1 gen 1977 anni
-0.017
-0.024
-335.24%
1 gen 1978 anni
0.099
+0.116
-694.14%
1 gen 1979 anni
0.796
+0.697
703.56%
1 gen 1980 anni
0.026
-0.771
-96.76%
1 gen 1981 anni
0.062
+0.037
141.33%
1 gen 1982 anni
0.012
-0.05
-80.73%
1 gen 1983 anni
-0.002
-0.014
-115.55%
1 gen 1984 anni
0.075
+0.077
-4.13 Mille.%
1 gen 1985 anni
0.015
-0.061
-80.69%
1 gen 1986 anni
0.026
+0.012
79.66%
1 gen 1987 anni
0.057
+0.031
116.77%
1 gen 1988 anni
0.263
+0.207
364.7%
1 gen 1989 anni
0.386
+0.122
46.54%
1 gen 1990 anni
0.329
-0.057
-14.78%
1 gen 1991 anni
0.258
-0.07
-21.43%
1 gen 1994 anni
0.723
+0.465
179.93%
1 gen 1995 anni
0.775
+0.052
7.15%
1 gen 1996 anni
0.641
-0.134
-17.25%
1 gen 1997 anni
0.361
-0.28
-43.73%
1 gen 1998 anni
0.494
+0.134
37.03%
1 gen 1999 anni
0.44
-0.054
-10.96%
1 gen 2000 anni
0.435
-0.005
-1.1%
1 gen 2001 anni
0.338
-0.098
-22.44%
1 gen 2002 anni
0.258
-0.079
-23.49%
1 gen 2003 anni
0.228
-0.03
-11.74%
1 gen 2004 anni
0.202
-0.026
-11.57%
1 gen 2005 anni
0.237
+0.036
17.77%
1 gen 2006 anni
0.137
-0.101
-42.44%
1 gen 2007 anni
0.124
-0.013
-9.25%
1 gen 2008 anni
0.082
-0.042
-34.23%
1 gen 2009 anni
0.063
-0.018
-22.44%
1 gen 2010 anni
0.061
-0.003
-4.07%
1 gen 2011 anni
0.07
+0.009
14.97%
1 gen 2012 anni
0.05
-0.02
-28.64%
1 gen 2013 anni
0.066
+0.017
33.3%
1 gen 2014 anni
0.079
+0.012
18.78%
1 gen 2015 anni
0.057
-0.022
-28.07%
Classificazione dei paesi secondo i statistiche attuali per anni


Commenti: