30
/it/
AIzaSyAYiBZKx7MnpbEhh9jyipgxe19OcubqV5w
April 1, 2024
138423
Georgia
GEO
true
2
1
Net ODA received (% of gross capital formation)
2015,2014,2013,2012,2011,2010,2009,2008,2007,2006,2005,2004,2003,2002,2001,2000,1999,1998,1997,1996,1995,1994,1993,1992
Download
Biblioteca di statistiche globali →Georgia →

Net ODA received (% of gross capital formation)

Queste statistiche in altri paesi:

AfghanistanAlbaniaAlgeriaAngolaAntigua and BarbudaArab WorldArgentinaArmeniaArubaAzerbaijanBahamas, TheBahrainBangladeshBarbadosBelarusBelizeBeninBhutanBoliviaBosnia and HerzegovinaBotswanaBrazilBrunei DarussalamBurkina FasoBurundiCabo VerdeCambodiaCameroonCaribbean small statesCentral African RepublicCentral Europe and the BalticsChadChileChinaColombiaComorosCongo, Dem. Rep.Congo, Rep.Costa RicaCote d'IvoireCroatiaCubaCyprusDjiboutiDominicaDominican RepublicEast Asia & PacificEast Asia & Pacific (excluding high income)East Asia & Pacific (IDA & IBRD countries)EcuadorEgypt, Arab Rep.El SalvadorEquatorial GuineaEritreaEthiopiaEuro areaEurope & Central AsiaEurope & Central Asia (excluding high income)Europe & Central Asia (IDA & IBRD countries)European UnionFijiFragile and conflict affected situationsGabonGambia, TheGeorgiaGhanaGrenadaGuatemalaGuineaGuinea-BissauGuyanaHaitiHeavily indebted poor countries (HIPC)High incomeHondurasHong Kong SAR, ChinaIBRD onlyIDA & IBRD totalIDA blendIDA onlyIDA totalIndiaIndonesiaIran, Islamic Rep.IraqIsraelJamaicaJordanKazakhstanKenyaKiribatiKorea, Rep.KosovoKuwaitKyrgyz RepublicLao PDRLatin America & Caribbean Latin America & Caribbean (excluding high income)Latin America & the Caribbean (IDA & IBRD countries)Least developed countries: UN classificationLebanonLesothoLiberiaLibyaLow & middle incomeLow incomeLower middle incomeMacao SAR, ChinaMacedonia, FYRMadagascarMalawiMalaysiaMaldivesMaliMaltaMauritaniaMauritiusMexicoMiddle East & North AfricaMiddle East & North Africa (excluding high income)Middle East & North Africa (IDA & IBRD countries)Middle incomeMoldovaMongoliaMontenegroMoroccoMozambiqueNamibiaNepalNew CaledoniaNicaraguaNigerNigeriaNorth AmericaOECD membersOmanOther small statesPakistanPanamaPapua New GuineaParaguayPeruPhilippinesQatarRwandaSaudi ArabiaSenegalSerbiaSeychellesSierra LeoneSingaporeSloveniaSmall statesSolomon IslandsSouth AfricaSouth AsiaSouth Asia (IDA & IBRD)South SudanSri LankaSt. Kitts and NevisSt. LuciaSt. Vincent and the GrenadinesSub-Saharan Africa Sub-Saharan Africa (excluding high income)Sub-Saharan Africa (IDA & IBRD countries)SudanSurinameSwazilandSyrian Arab RepublicTajikistanTanzaniaThailandTimor-LesteTogoTongaTrinidad and TobagoTunisiaTurkeyTurkmenistanUgandaUkraineUpper middle incomeUruguayUzbekistanVanuatuVenezuela, RBVietnamWest Bank and GazaWorldYemen, Rep.ZambiaZimbabwe

Linea del tempo:

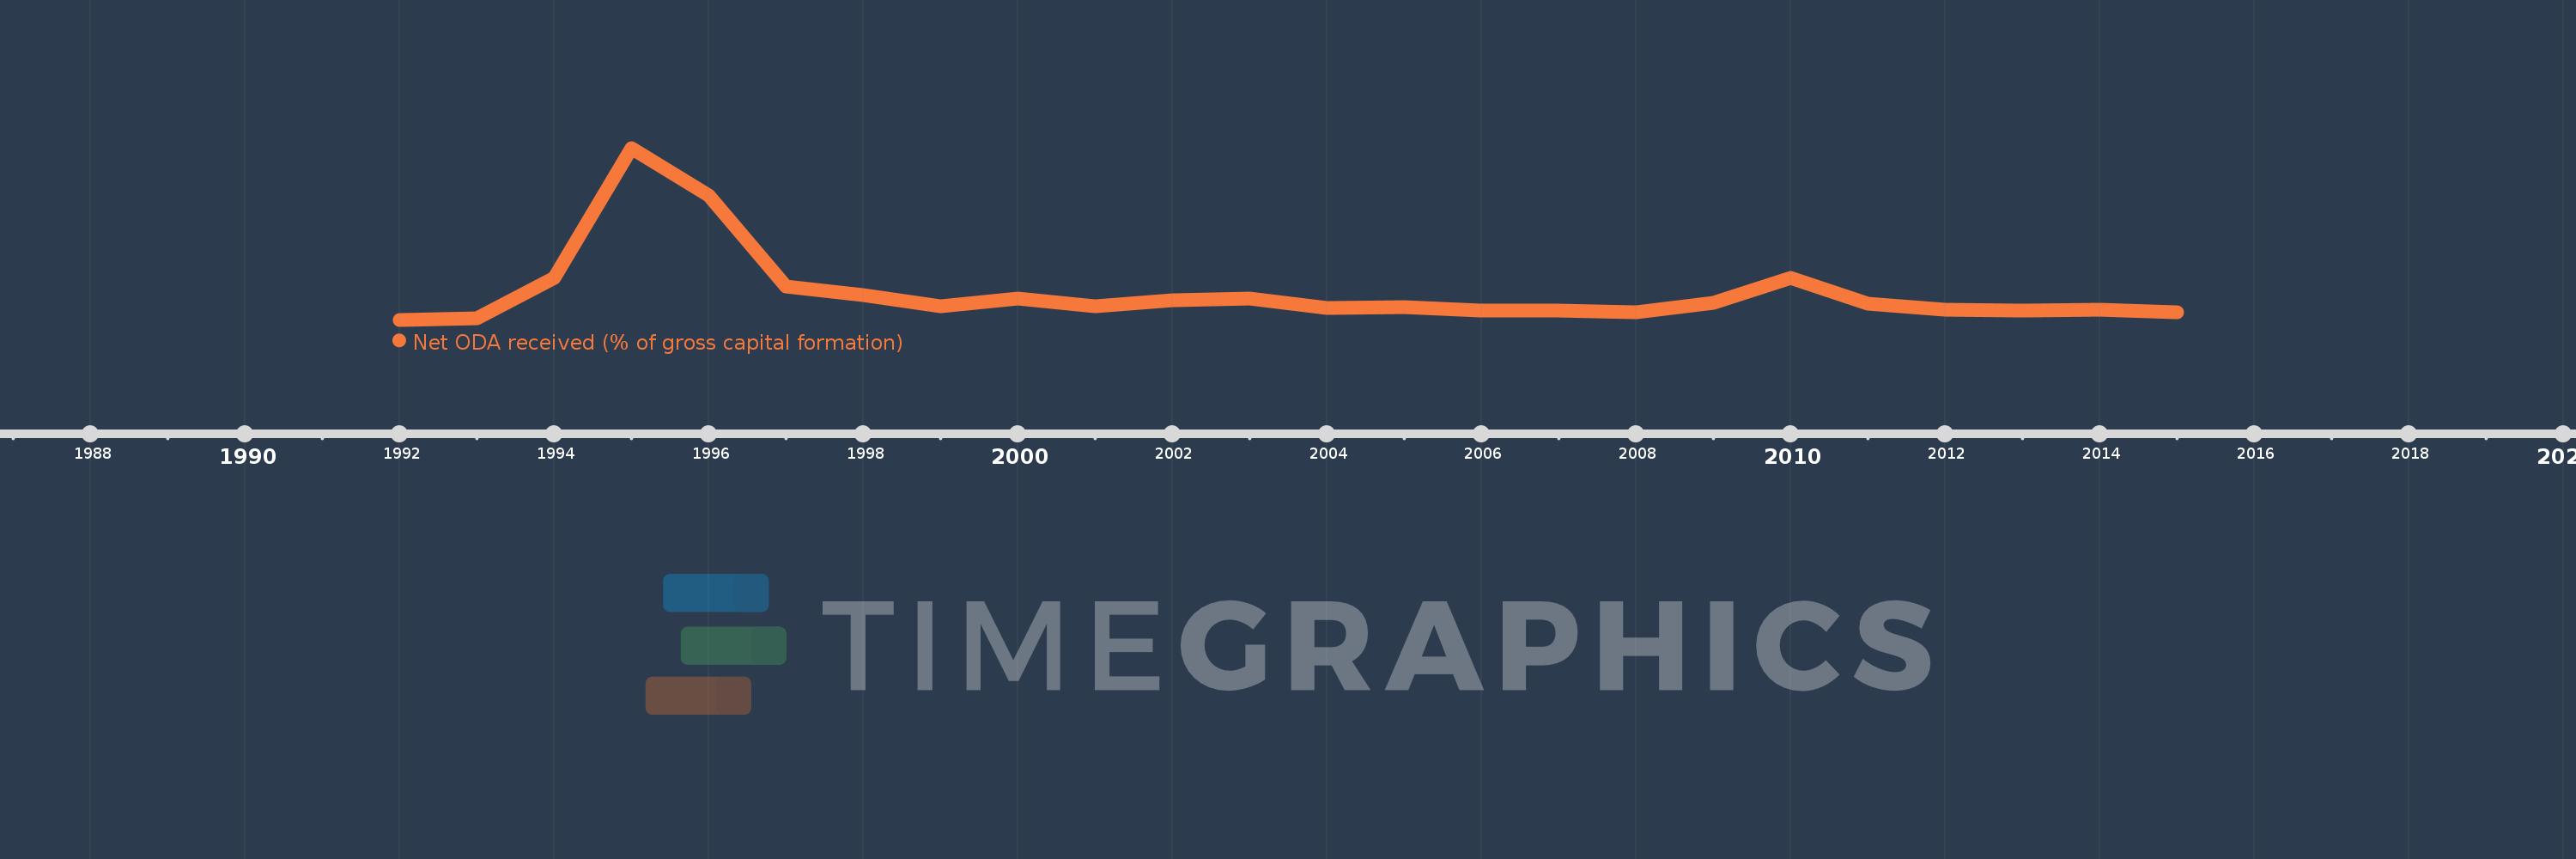
Questa scala temporale mostra un grafico dal 1992 anno al 2015 anno. Georgia. I dati fino ad 1991 anno non disponibili. Il numero di osservazioni attuali secondo i date: 24.

La fonte (nome):

Indicatori dello sviluppo mondiale

La fonte (organizzazione):

Development Assistance Committee of the Organisation for Economic Co-operation and Development, Geographical Distribution of Financial Flows to Developing Countries, Development Co-operation Report, and International Development Statistics database. Data are available online at: www.oecd.org/dac/stats/idsonline. World Bank gross capital formation estimates are used for the denominator.

Categorie:

Aid Effectiveness

sono stati aggiornati

23 apr 2017 anni

Indicatori delle variazioni dei valori per anni

In media:
41.864
Minima:
0.012
1 gen 1992 anni
Massimo:
266.521
1 gen 1995 anni
Alla data di osservazione
Valore
Variazione assoluta
La variazione rispetto al valore precedente
1 gen 1992 anni
0.012
+0.012
0.0%
1 gen 1993 anni
2.357
+2.346
19.97 Mille.%
1 gen 1994 anni
64.652
+62.294
2.64 Mille.%
1 gen 1995 anni
266.521
+201.869
312.24%
1 gen 1996 anni
192.442
-74.079
-27.79%
1 gen 1997 anni
51.011
-141.43
-73.49%
1 gen 1998 anni
38.627
-12.384
-24.28%
1 gen 1999 anni
21.238
-17.389
-45.02%
1 gen 2000 anni
32.988
+11.75
55.32%
1 gen 2001 anni
20.813
-12.175
-36.91%
1 gen 2002 anni
29.839
+9.026
43.37%
1 gen 2003 anni
32.489
+2.65
8.88%
1 gen 2004 anni
18.399
-14.09
-43.37%
1 gen 2005 anni
19.165
+0.766
4.16%
1 gen 2006 anni
13.606
-5.559
-29.01%
1 gen 2007 anni
14.901
+1.295
9.52%
1 gen 2008 anni
11.642
-3.259
-21.87%
1 gen 2009 anni
26.747
+15.105
129.74%
1 gen 2010 anni
64.721
+37.973
141.97%
1 gen 2011 anni
24.988
-39.733
-61.39%
1 gen 2012 anni
15.571
-9.417
-37.68%
1 gen 2013 anni
14.397
-1.175
-7.54%
1 gen 2014 anni
16.183
+1.787
12.41%
1 gen 2015 anni
11.437
-4.747
-29.33%

Classificazione dei paesi secondo i statistiche attuali per anni