29
/it/
it
AIzaSyAYiBZKx7MnpbEhh9jyipgxe19OcubqV5w
April 1, 2024
29353
East Asia & Pacific (IDA & IBRD countries)
TEA
false
2
1
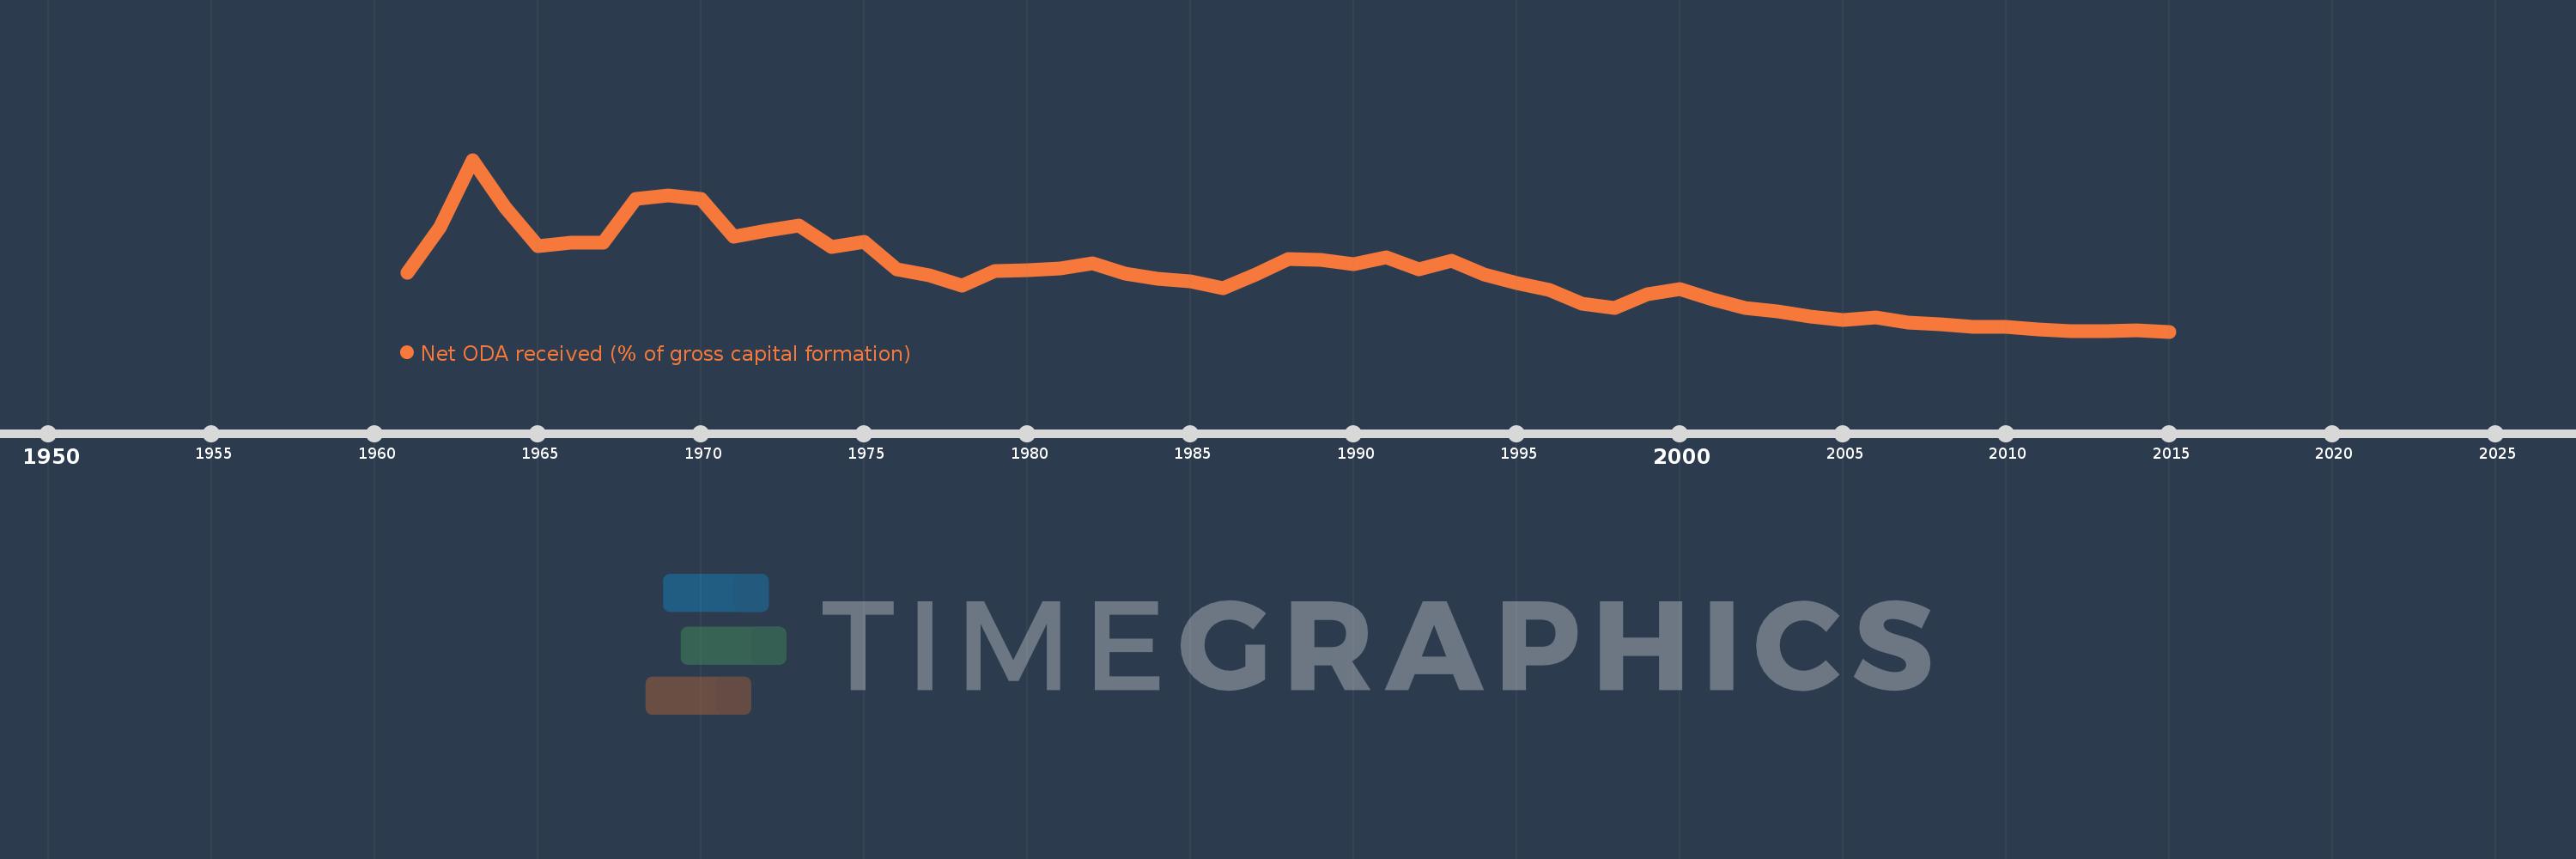
Net ODA received (% of gross capital formation)
2015,2014,2013,2012,2011,2010,2009,2008,2007,2006,2005,2004,2003,2002,2001,2000,1999,1998,1997,1996,1995,1994,1993,1992,1991,1990,1989,1988,1987,1986,1985,1984,1983,1982,1981,1980,1979,1978,1977,1976,1975,1974,1973,1972,1971,1970,1969,1968,1967,1966,1965,1964,1963,1962,1961
Queste statistiche in altri paesi:
AfghanistanAlbaniaAlgeriaAngolaAntigua and BarbudaArab WorldArgentinaArmeniaArubaAzerbaijanBahamas, TheBahrainBangladeshBarbadosBelarusBelizeBeninBhutanBoliviaBosnia and HerzegovinaBotswanaBrazilBrunei DarussalamBurkina FasoBurundiCabo VerdeCambodiaCameroonCaribbean small statesCentral African RepublicCentral Europe and the BalticsChadChileChinaColombiaComorosCongo, Dem. Rep.Congo, Rep.Costa RicaCote d'IvoireCroatiaCubaCyprusDjiboutiDominicaDominican RepublicEast Asia & PacificEast Asia & Pacific (excluding high income)East Asia & Pacific (IDA & IBRD countries)EcuadorEgypt, Arab Rep.El SalvadorEquatorial GuineaEritreaEthiopiaEuro areaEurope & Central AsiaEurope & Central Asia (excluding high income)Europe & Central Asia (IDA & IBRD countries)European UnionFijiFragile and conflict affected situationsGabonGambia, TheGeorgiaGhanaGrenadaGuatemalaGuineaGuinea-BissauGuyanaHaitiHeavily indebted poor countries (HIPC)High incomeHondurasHong Kong SAR, ChinaIBRD onlyIDA & IBRD totalIDA blendIDA onlyIDA totalIndiaIndonesiaIran, Islamic Rep.IraqIsraelJamaicaJordanKazakhstanKenyaKiribatiKorea, Rep.KosovoKuwaitKyrgyz RepublicLao PDRLatin America & Caribbean Latin America & Caribbean (excluding high income)Latin America & the Caribbean (IDA & IBRD countries)Least developed countries: UN classificationLebanonLesothoLiberiaLibyaLow & middle incomeLow incomeLower middle incomeMacao SAR, ChinaMacedonia, FYRMadagascarMalawiMalaysiaMaldivesMaliMaltaMauritaniaMauritiusMexicoMiddle East & North AfricaMiddle East & North Africa (excluding high income)Middle East & North Africa (IDA & IBRD countries)Middle incomeMoldovaMongoliaMontenegroMoroccoMozambiqueNamibiaNepalNew CaledoniaNicaraguaNigerNigeriaNorth AmericaOECD membersOmanOther small statesPakistanPanamaPapua New GuineaParaguayPeruPhilippinesQatarRwandaSaudi ArabiaSenegalSerbiaSeychellesSierra LeoneSingaporeSloveniaSmall statesSolomon IslandsSouth AfricaSouth AsiaSouth Asia (IDA & IBRD)South SudanSri LankaSt. Kitts and NevisSt. LuciaSt. Vincent and the GrenadinesSub-Saharan Africa Sub-Saharan Africa (excluding high income)Sub-Saharan Africa (IDA & IBRD countries)SudanSurinameSwazilandSyrian Arab RepublicTajikistanTanzaniaThailandTimor-LesteTogoTongaTrinidad and TobagoTunisiaTurkeyTurkmenistanUgandaUkraineUpper middle incomeUruguayUzbekistanVanuatuVenezuela, RBVietnamWest Bank and GazaWorldYemen, Rep.ZambiaZimbabwe Linea del tempo:
Questa scala temporale mostra un grafico dal 1961 anno al 2015 anno. East Asia & Pacific (IDA & IBRD countries). I dati fino ad 1960 anno non disponibili. Il numero di osservazioni attuali secondo i date: 55.
La fonte (nome):
Indicatori dello sviluppo mondiale
La fonte (organizzazione):
Development Assistance Committee of the Organisation for Economic Co-operation and Development, Geographical Distribution of Financial Flows to Developing Countries, Development Co-operation Report, and International Development Statistics database. Data are available online at: www.oecd.org/dac/stats/idsonline. World Bank gross capital formation estimates are used for the denominator.
Categorie:
Aid Effectiveness
sono stati aggiornati
23 apr 2017 anni
Indicatori delle variazioni dei valori per anni
Minima:
0.153
1 gen 2015 anni
Massimo:
7.551
1 gen 1963 anni
Alla data di osservazione
Valore
Variazione assoluta
La variazione rispetto al valore precedente
1 gen 1961 anni
2.685
+2.685
0.0%
1 gen 1962 anni
4.662
+1.977
73.64%
1 gen 1963 anni
7.551
+2.889
61.97%
1 gen 1964 anni
5.483
-2.068
-27.39%
1 gen 1965 anni
3.816
-1.666
-30.39%
1 gen 1966 anni
3.986
+0.169
4.44%
1 gen 1967 anni
3.977
-0.009
-0.22%
1 gen 1968 anni
5.852
+1.875
47.14%
1 gen 1969 anni
5.998
+0.147
2.51%
1 gen 1970 anni
5.873
-0.125
-2.08%
1 gen 1971 anni
4.229
-1.645
-28.0%
1 gen 1972 anni
4.514
+0.285
6.74%
1 gen 1973 anni
4.736
+0.223
4.93%
1 gen 1974 anni
3.786
-0.95
-20.06%
1 gen 1975 anni
4.01
+0.223
5.9%
1 gen 1976 anni
2.82
-1.19
-29.68%
1 gen 1977 anni
2.579
-0.241
-8.56%
1 gen 1978 anni
2.135
-0.444
-17.22%
1 gen 1979 anni
2.749
+0.614
28.78%
1 gen 1980 anni
2.811
+0.062
2.24%
1 gen 1981 anni
2.88
+0.07
2.48%
1 gen 1982 anni
3.112
+0.232
8.06%
1 gen 1983 anni
2.633
-0.479
-15.41%
1 gen 1984 anni
2.436
-0.197
-7.49%
1 gen 1985 anni
2.33
-0.106
-4.35%
1 gen 1986 anni
2.014
-0.316
-13.57%
1 gen 1987 anni
2.603
+0.589
29.26%
1 gen 1988 anni
3.262
+0.659
25.32%
1 gen 1989 anni
3.238
-0.024
-0.72%
1 gen 1990 anni
3.065
-0.173
-5.35%
1 gen 1991 anni
3.344
+0.279
9.11%
1 gen 1992 anni
2.839
-0.505
-15.1%
1 gen 1993 anni
3.215
+0.376
13.25%
1 gen 1994 anni
2.604
-0.611
-19.01%
1 gen 1995 anni
2.231
-0.373
-14.31%
1 gen 1996 anni
1.934
-0.297
-13.32%
1 gen 1997 anni
1.368
-0.566
-29.28%
1 gen 1998 anni
1.179
-0.188
-13.77%
1 gen 1999 anni
1.756
+0.577
48.93%
1 gen 2000 anni
1.982
+0.226
12.86%
1 gen 2001 anni
1.538
-0.444
-22.42%
1 gen 2002 anni
1.178
-0.359
-23.38%
1 gen 2003 anni
1.016
-0.162
-13.76%
1 gen 2004 anni
0.811
-0.205
-20.19%
1 gen 2005 anni
0.638
-0.173
-21.28%
1 gen 2006 anni
0.769
+0.131
20.46%
1 gen 2007 anni
0.533
-0.236
-30.63%
1 gen 2008 anni
0.461
-0.073
-13.63%
1 gen 2009 anni
0.343
-0.117
-25.49%
1 gen 2010 anni
0.349
+0.006
1.6%
1 gen 2011 anni
0.263
-0.086
-24.54%
1 gen 2012 anni
0.166
-0.097
-36.86%
1 gen 2013 anni
0.171
+0.004
2.68%
1 gen 2014 anni
0.213
+0.042
24.65%
1 gen 2015 anni
0.153
-0.059
-27.92%
Classificazione dei paesi secondo i statistiche attuali per anni


Commenti: