29
/it/
it
AIzaSyAYiBZKx7MnpbEhh9jyipgxe19OcubqV5w
April 1, 2024
199539
Mongolia
MNG
true
2
1
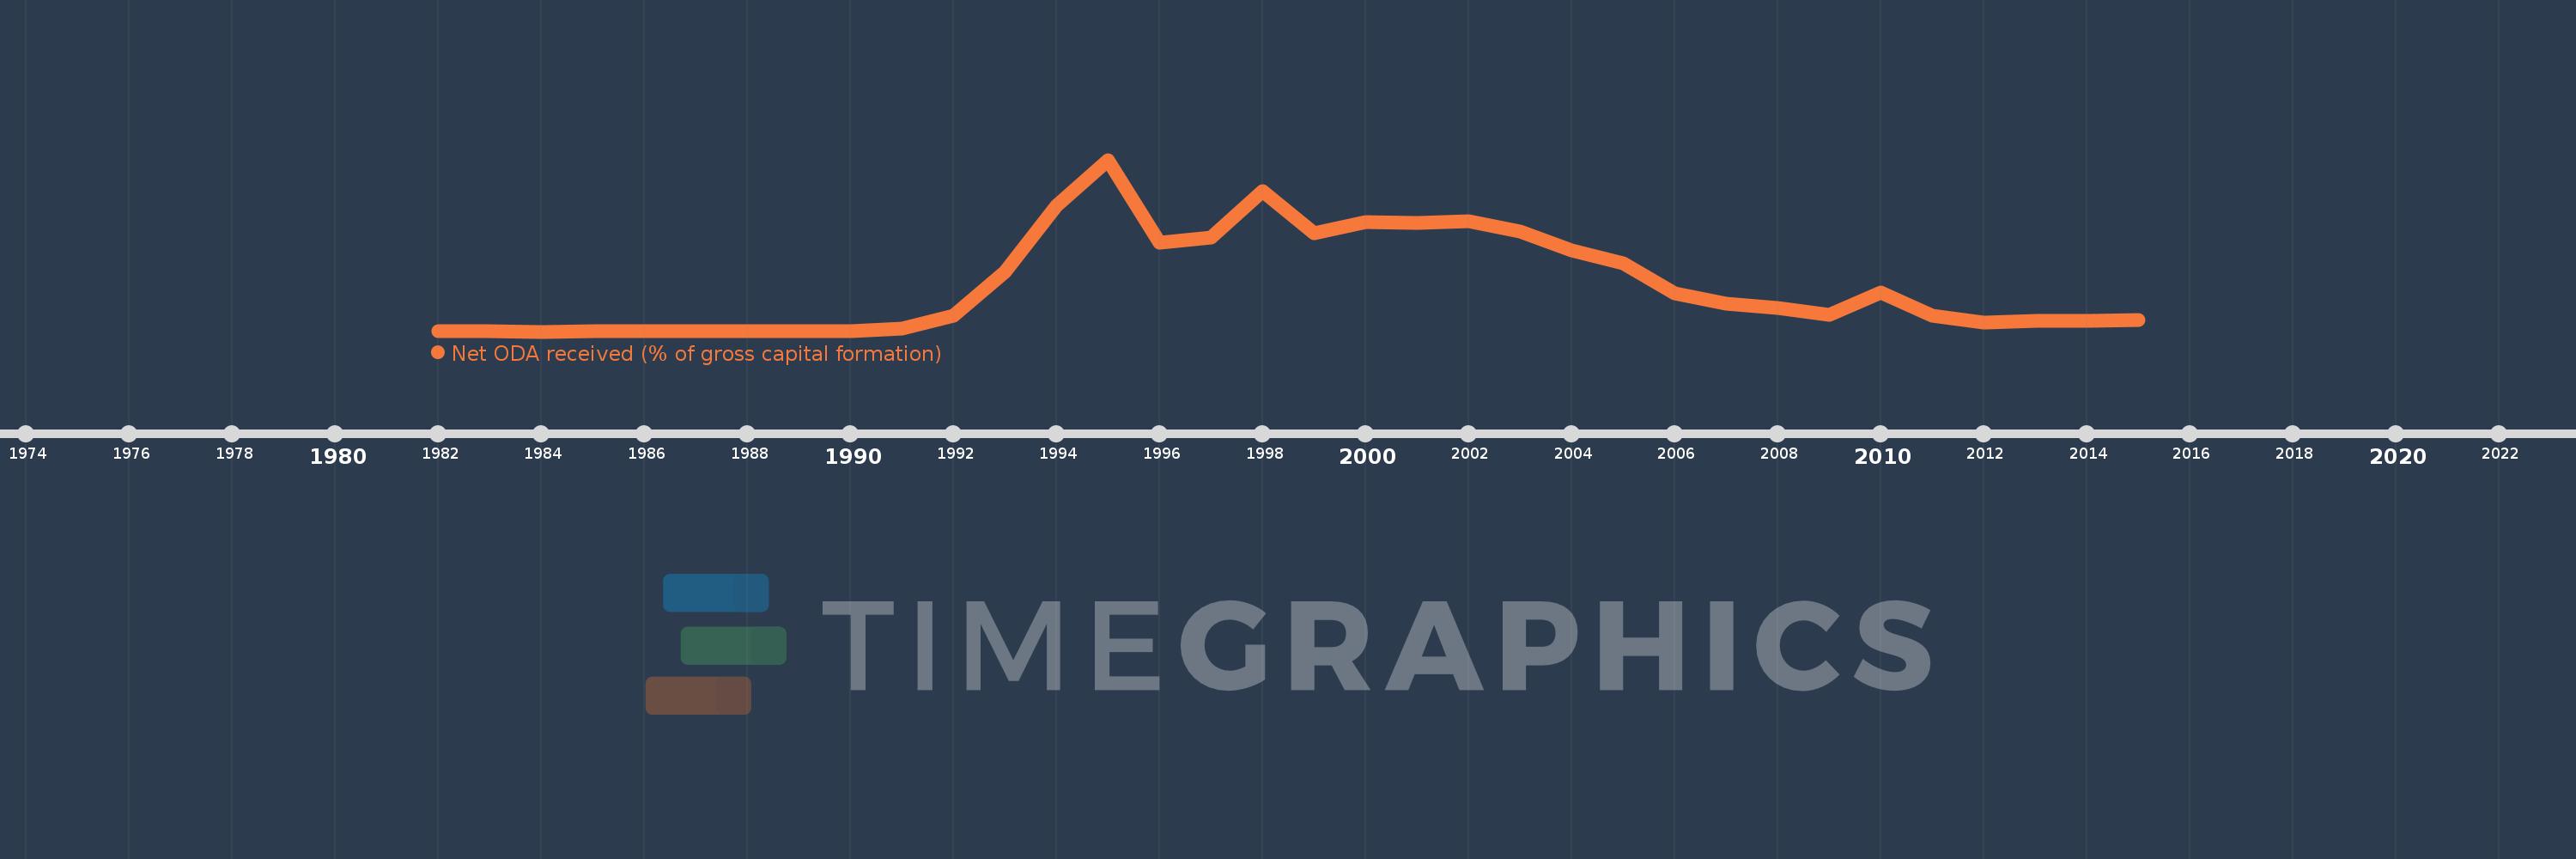
Net ODA received (% of gross capital formation)
2015,2014,2013,2012,2011,2010,2009,2008,2007,2006,2005,2004,2003,2002,2001,2000,1999,1998,1997,1996,1995,1994,1993,1992,1991,1990,1989,1988,1987,1986,1985,1984,1983,1982
Queste statistiche in altri paesi:
AfghanistanAlbaniaAlgeriaAngolaAntigua and BarbudaArab WorldArgentinaArmeniaArubaAzerbaijanBahamas, TheBahrainBangladeshBarbadosBelarusBelizeBeninBhutanBoliviaBosnia and HerzegovinaBotswanaBrazilBrunei DarussalamBurkina FasoBurundiCabo VerdeCambodiaCameroonCaribbean small statesCentral African RepublicCentral Europe and the BalticsChadChileChinaColombiaComorosCongo, Dem. Rep.Congo, Rep.Costa RicaCote d'IvoireCroatiaCubaCyprusDjiboutiDominicaDominican RepublicEast Asia & PacificEast Asia & Pacific (excluding high income)East Asia & Pacific (IDA & IBRD countries)EcuadorEgypt, Arab Rep.El SalvadorEquatorial GuineaEritreaEthiopiaEuro areaEurope & Central AsiaEurope & Central Asia (excluding high income)Europe & Central Asia (IDA & IBRD countries)European UnionFijiFragile and conflict affected situationsGabonGambia, TheGeorgiaGhanaGrenadaGuatemalaGuineaGuinea-BissauGuyanaHaitiHeavily indebted poor countries (HIPC)High incomeHondurasHong Kong SAR, ChinaIBRD onlyIDA & IBRD totalIDA blendIDA onlyIDA totalIndiaIndonesiaIran, Islamic Rep.IraqIsraelJamaicaJordanKazakhstanKenyaKiribatiKorea, Rep.KosovoKuwaitKyrgyz RepublicLao PDRLatin America & Caribbean Latin America & Caribbean (excluding high income)Latin America & the Caribbean (IDA & IBRD countries)Least developed countries: UN classificationLebanonLesothoLiberiaLibyaLow & middle incomeLow incomeLower middle incomeMacao SAR, ChinaMacedonia, FYRMadagascarMalawiMalaysiaMaldivesMaliMaltaMauritaniaMauritiusMexicoMiddle East & North AfricaMiddle East & North Africa (excluding high income)Middle East & North Africa (IDA & IBRD countries)Middle incomeMoldovaMongoliaMontenegroMoroccoMozambiqueNamibiaNepalNew CaledoniaNicaraguaNigerNigeriaNorth AmericaOECD membersOmanOther small statesPakistanPanamaPapua New GuineaParaguayPeruPhilippinesQatarRwandaSaudi ArabiaSenegalSerbiaSeychellesSierra LeoneSingaporeSloveniaSmall statesSolomon IslandsSouth AfricaSouth AsiaSouth Asia (IDA & IBRD)South SudanSri LankaSt. Kitts and NevisSt. LuciaSt. Vincent and the GrenadinesSub-Saharan Africa Sub-Saharan Africa (excluding high income)Sub-Saharan Africa (IDA & IBRD countries)SudanSurinameSwazilandSyrian Arab RepublicTajikistanTanzaniaThailandTimor-LesteTogoTongaTrinidad and TobagoTunisiaTurkeyTurkmenistanUgandaUkraineUpper middle incomeUruguayUzbekistanVanuatuVenezuela, RBVietnamWest Bank and GazaWorldYemen, Rep.ZambiaZimbabwe Linea del tempo:
Questa scala temporale mostra un grafico dal 1982 anno al 2015 anno. Mongolia. I dati fino ad 1981 anno non disponibili. Il numero di osservazioni attuali secondo i date: 34.
La fonte (nome):
Indicatori dello sviluppo mondiale
La fonte (organizzazione):
Development Assistance Committee of the Organisation for Economic Co-operation and Development, Geographical Distribution of Financial Flows to Developing Countries, Development Co-operation Report, and International Development Statistics database. Data are available online at: www.oecd.org/dac/stats/idsonline. World Bank gross capital formation estimates are used for the denominator.
Categorie:
Aid Effectiveness
sono stati aggiornati
23 apr 2017 anni
Indicatori delle variazioni dei valori per anni
Minima:
0.126
1 gen 1984 anni
Massimo:
103.71
1 gen 1995 anni
Alla data di osservazione
Valore
Variazione assoluta
La variazione rispetto al valore precedente
1 gen 1982 anni
0.149
+0.149
0.0%
1 gen 1983 anni
0.134
-0.015
-9.85%
1 gen 1984 anni
0.126
-0.007
-5.52%
1 gen 1985 anni
0.175
+0.048
38.16%
1 gen 1986 anni
0.377
+0.202
115.47%
1 gen 1987 anni
0.353
-0.024
-6.37%
1 gen 1988 anni
0.305
-0.048
-13.55%
1 gen 1989 anni
0.255
-0.049
-16.22%
1 gen 1990 anni
0.356
+0.101
39.47%
1 gen 1991 anni
1.753
+1.397
392.23%
1 gen 1992 anni
9.589
+7.836
446.96%
1 gen 1993 anni
36.322
+26.733
278.77%
1 gen 1994 anni
75.906
+39.584
108.98%
1 gen 1995 anni
103.71
+27.804
36.63%
1 gen 1996 anni
53.738
-49.972
-48.18%
1 gen 1997 anni
56.714
+2.976
5.54%
1 gen 1998 anni
84.886
+28.172
49.67%
1 gen 1999 anni
59.466
-25.42
-29.95%
1 gen 2000 anni
66.332
+6.866
11.55%
1 gen 2001 anni
65.781
-0.551
-0.83%
1 gen 2002 anni
66.919
+1.138
1.73%
1 gen 2003 anni
60.383
-6.536
-9.77%
1 gen 2004 anni
48.971
-11.412
-18.9%
1 gen 2005 anni
41.527
-7.445
-15.2%
1 gen 2006 anni
23.187
-18.339
-44.16%
1 gen 2007 anni
16.744
-6.443
-27.79%
1 gen 2008 anni
14.561
-2.183
-13.04%
1 gen 2009 anni
10.069
-4.493
-30.85%
1 gen 2010 anni
23.562
+13.493
134.02%
1 gen 2011 anni
9.952
-13.61
-57.76%
1 gen 2012 anni
5.775
-4.176
-41.97%
1 gen 2013 anni
6.462
+0.686
11.88%
1 gen 2014 anni
6.374
-0.088
-1.35%
1 gen 2015 anni
7.316
+0.942
14.77%
Classificazione dei paesi secondo i statistiche attuali per anni


Commenti: