29
/it/
it
AIzaSyAYiBZKx7MnpbEhh9jyipgxe19OcubqV5w
April 1, 2024
266078
Tonga
TON
true
2
1
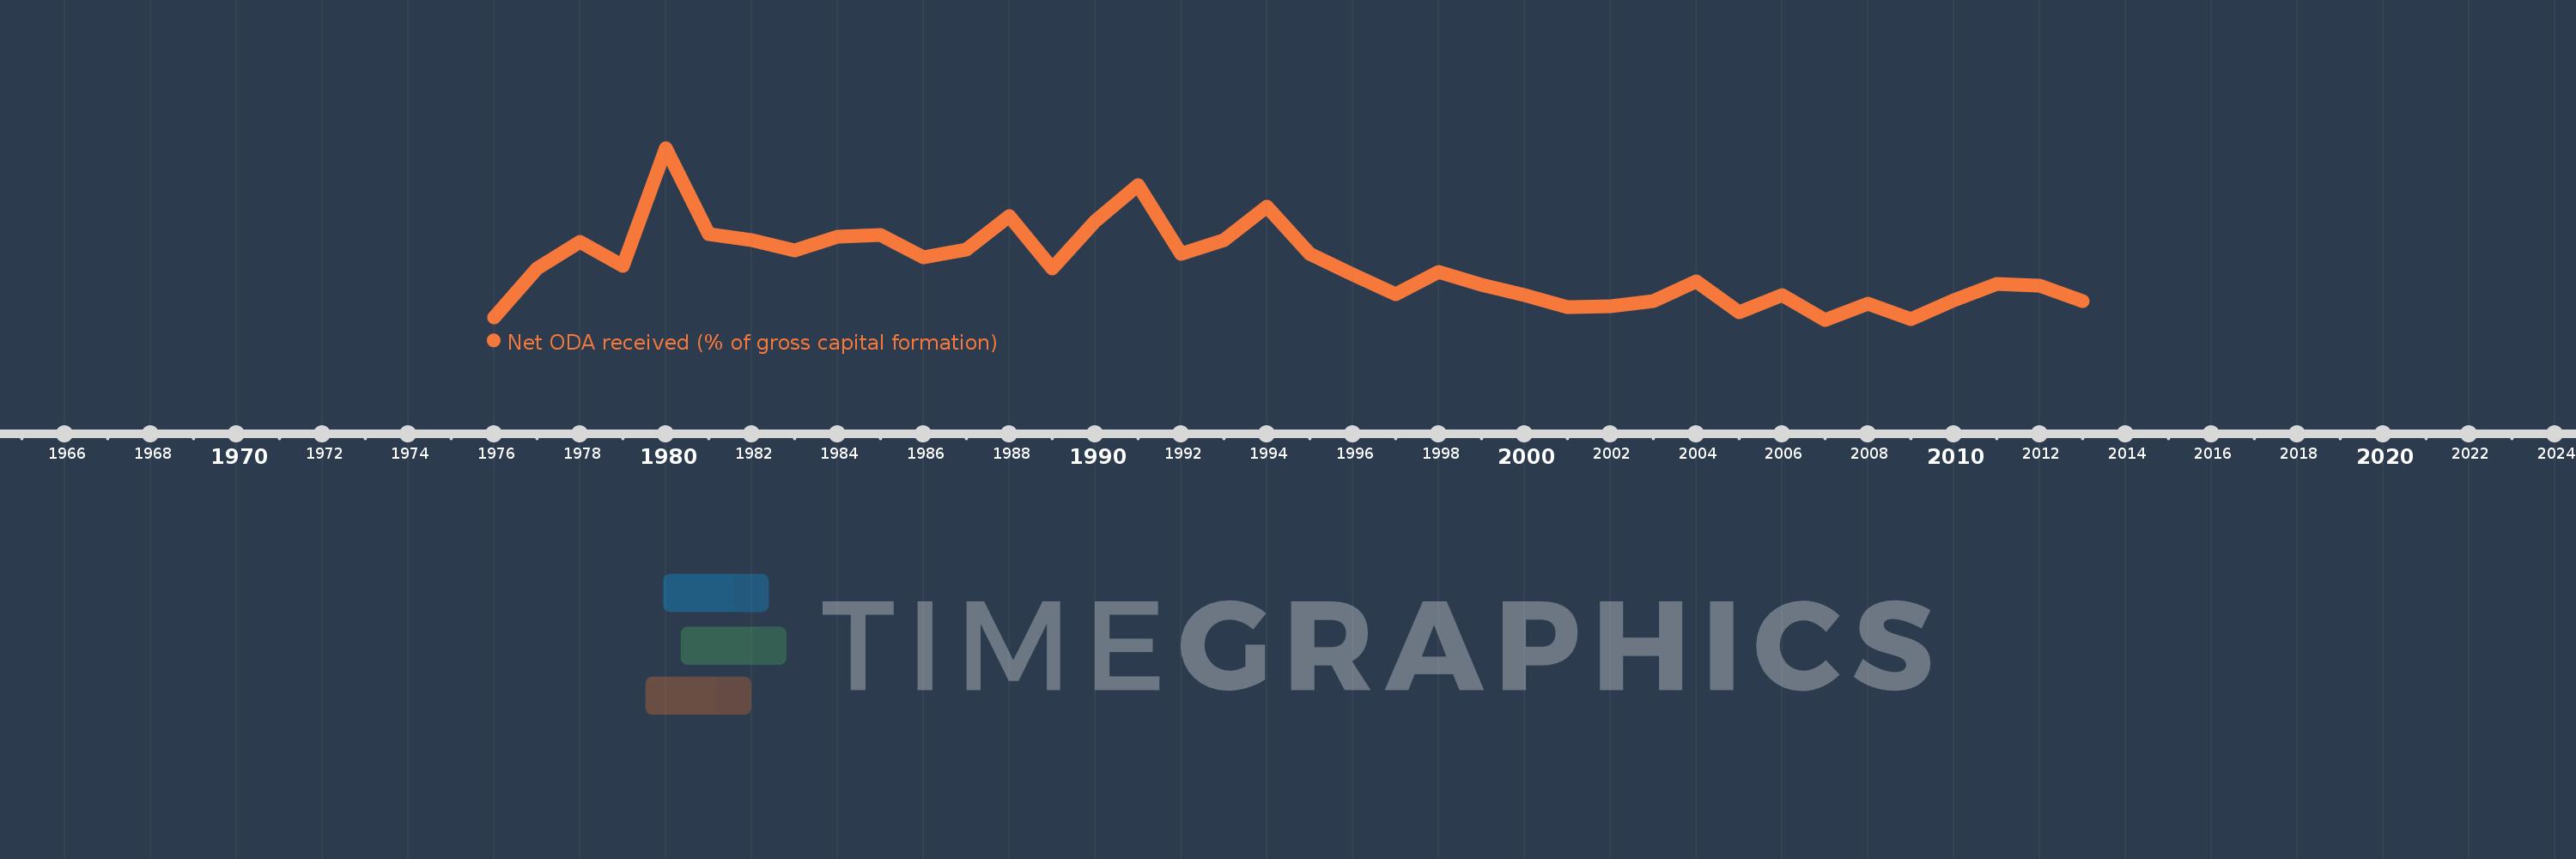
Net ODA received (% of gross capital formation)
2013,2012,2011,2010,2009,2008,2007,2006,2005,2004,2003,2002,2001,2000,1999,1998,1997,1996,1995,1994,1993,1992,1991,1990,1989,1988,1987,1986,1985,1984,1983,1982,1981,1980,1979,1978,1977,1976
Queste statistiche in altri paesi:
AfghanistanAlbaniaAlgeriaAngolaAntigua and BarbudaArab WorldArgentinaArmeniaArubaAzerbaijanBahamas, TheBahrainBangladeshBarbadosBelarusBelizeBeninBhutanBoliviaBosnia and HerzegovinaBotswanaBrazilBrunei DarussalamBurkina FasoBurundiCabo VerdeCambodiaCameroonCaribbean small statesCentral African RepublicCentral Europe and the BalticsChadChileChinaColombiaComorosCongo, Dem. Rep.Congo, Rep.Costa RicaCote d'IvoireCroatiaCubaCyprusDjiboutiDominicaDominican RepublicEast Asia & PacificEast Asia & Pacific (excluding high income)East Asia & Pacific (IDA & IBRD countries)EcuadorEgypt, Arab Rep.El SalvadorEquatorial GuineaEritreaEthiopiaEuro areaEurope & Central AsiaEurope & Central Asia (excluding high income)Europe & Central Asia (IDA & IBRD countries)European UnionFijiFragile and conflict affected situationsGabonGambia, TheGeorgiaGhanaGrenadaGuatemalaGuineaGuinea-BissauGuyanaHaitiHeavily indebted poor countries (HIPC)High incomeHondurasHong Kong SAR, ChinaIBRD onlyIDA & IBRD totalIDA blendIDA onlyIDA totalIndiaIndonesiaIran, Islamic Rep.IraqIsraelJamaicaJordanKazakhstanKenyaKiribatiKorea, Rep.KosovoKuwaitKyrgyz RepublicLao PDRLatin America & Caribbean Latin America & Caribbean (excluding high income)Latin America & the Caribbean (IDA & IBRD countries)Least developed countries: UN classificationLebanonLesothoLiberiaLibyaLow & middle incomeLow incomeLower middle incomeMacao SAR, ChinaMacedonia, FYRMadagascarMalawiMalaysiaMaldivesMaliMaltaMauritaniaMauritiusMexicoMiddle East & North AfricaMiddle East & North Africa (excluding high income)Middle East & North Africa (IDA & IBRD countries)Middle incomeMoldovaMongoliaMontenegroMoroccoMozambiqueNamibiaNepalNew CaledoniaNicaraguaNigerNigeriaNorth AmericaOECD membersOmanOther small statesPakistanPanamaPapua New GuineaParaguayPeruPhilippinesQatarRwandaSaudi ArabiaSenegalSerbiaSeychellesSierra LeoneSingaporeSloveniaSmall statesSolomon IslandsSouth AfricaSouth AsiaSouth Asia (IDA & IBRD)South SudanSri LankaSt. Kitts and NevisSt. LuciaSt. Vincent and the GrenadinesSub-Saharan Africa Sub-Saharan Africa (excluding high income)Sub-Saharan Africa (IDA & IBRD countries)SudanSurinameSwazilandSyrian Arab RepublicTajikistanTanzaniaThailandTimor-LesteTogoTongaTrinidad and TobagoTunisiaTurkeyTurkmenistanUgandaUkraineUpper middle incomeUruguayUzbekistanVanuatuVenezuela, RBVietnamWest Bank and GazaWorldYemen, Rep.ZambiaZimbabwe Linea del tempo:
Questa scala temporale mostra un grafico dal 1976 anno al 2013 anno. Tonga. I dati fino ad 1975 anno non disponibili. Il numero di osservazioni attuali secondo i date: 38.
La fonte (nome):
Indicatori dello sviluppo mondiale
La fonte (organizzazione):
Development Assistance Committee of the Organisation for Economic Co-operation and Development, Geographical Distribution of Financial Flows to Developing Countries, Development Co-operation Report, and International Development Statistics database. Data are available online at: www.oecd.org/dac/stats/idsonline. World Bank gross capital formation estimates are used for the denominator.
Categorie:
Aid Effectiveness
sono stati aggiornati
23 apr 2017 anni
Indicatori delle variazioni dei valori per anni
Minima:
34.598
1 gen 2007 anni
Massimo:
170.889
1 gen 1980 anni
Alla data di osservazione
Valore
Variazione assoluta
La variazione rispetto al valore precedente
1 gen 1976 anni
36.457
+36.457
0.0%
1 gen 1977 anni
74.985
+38.528
105.68%
1 gen 1978 anni
96.732
+21.747
29.0%
1 gen 1979 anni
77.204
-19.528
-20.19%
1 gen 1980 anni
170.889
+93.685
121.35%
1 gen 1981 anni
102.325
-68.564
-40.12%
1 gen 1982 anni
97.993
-4.332
-4.23%
1 gen 1983 anni
89.58
-8.413
-8.59%
1 gen 1984 anni
100.273
+10.693
11.94%
1 gen 1985 anni
101.628
+1.356
1.35%
1 gen 1986 anni
84.311
-17.317
-17.04%
1 gen 1987 anni
90.541
+6.23
7.39%
1 gen 1988 anni
117.015
+26.473
29.24%
1 gen 1989 anni
75.557
-41.458
-35.43%
1 gen 1990 anni
112.728
+37.172
49.2%
1 gen 1991 anni
141.655
+28.927
25.66%
1 gen 1992 anni
87.175
-54.48
-38.46%
1 gen 1993 anni
97.535
+10.36
11.88%
1 gen 1994 anni
124.632
+27.096
27.78%
1 gen 1995 anni
87.082
-37.55
-30.13%
1 gen 1996 anni
70.818
-16.264
-18.68%
1 gen 1997 anni
55.167
-15.652
-22.1%
1 gen 1998 anni
72.367
+17.201
31.18%
1 gen 1999 anni
62.503
-9.864
-13.63%
1 gen 2000 anni
54.24
-8.263
-13.22%
1 gen 2001 anni
44.776
-9.464
-17.45%
1 gen 2002 anni
45.634
+0.858
1.92%
1 gen 2003 anni
49.418
+3.784
8.29%
1 gen 2004 anni
65.058
+15.639
31.65%
1 gen 2005 anni
40.235
-24.823
-38.16%
1 gen 2006 anni
54.343
+14.109
35.07%
1 gen 2007 anni
34.598
-19.745
-36.33%
1 gen 2008 anni
47.315
+12.716
36.75%
1 gen 2009 anni
35.343
-11.972
-25.3%
1 gen 2010 anni
50.253
+14.91
42.19%
1 gen 2011 anni
63.343
+13.09
26.05%
1 gen 2012 anni
61.336
-2.007
-3.17%
1 gen 2013 anni
49.638
-11.698
-19.07%
Classificazione dei paesi secondo i statistiche attuali per anni


Commenti: