29
/it/
it
AIzaSyAYiBZKx7MnpbEhh9jyipgxe19OcubqV5w
April 1, 2024
37208
IDA & IBRD total
IBT
false
2
1
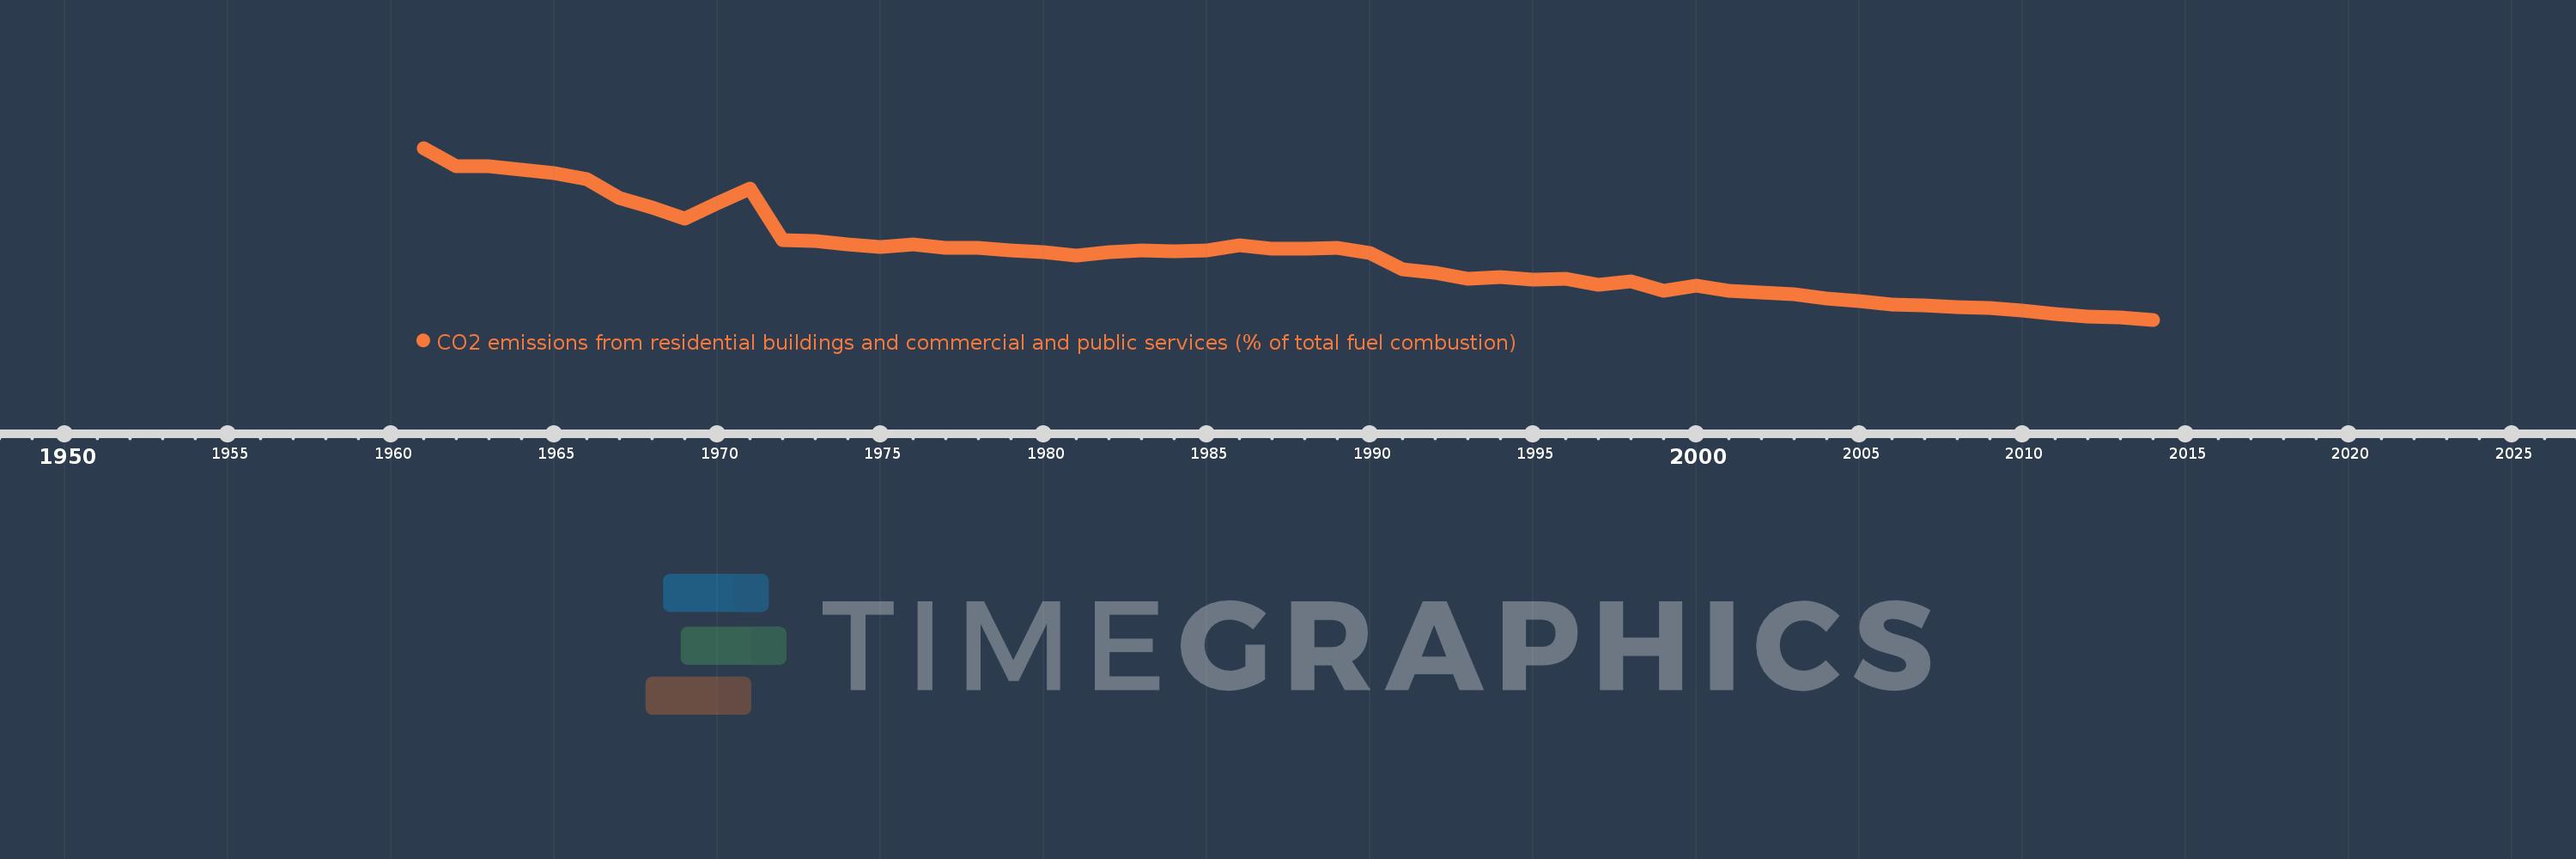
CO2 emissions from residential buildings and commercial and public services (% of total fuel combustion)
2014,2013,2012,2011,2010,2009,2008,2007,2006,2005,2004,2003,2002,2001,2000,1999,1998,1997,1996,1995,1994,1993,1992,1991,1990,1989,1988,1987,1986,1985,1984,1983,1982,1981,1980,1979,1978,1977,1976,1975,1974,1973,1972,1971,1970,1969,1968,1967,1966,1965,1964,1963,1962,1961
Queste statistiche in altri paesi:
AlbaniaAlgeriaAngolaArab WorldArgentinaArmeniaAustraliaAustriaAzerbaijanBahrainBangladeshBelarusBelgiumBeninBoliviaBosnia and HerzegovinaBotswanaBrazilBrunei DarussalamBulgariaCambodiaCameroonCanadaCaribbean small statesCentral Europe and the BalticsChileChinaColombiaCongo, Dem. Rep.Congo, Rep.Costa RicaCote d'IvoireCroatiaCubaCuracaoCyprusCzech RepublicDenmarkDominican RepublicEarly-demographic dividendEast Asia & PacificEast Asia & Pacific (excluding high income)East Asia & Pacific (IDA & IBRD countries)EcuadorEgypt, Arab Rep.El SalvadorEritreaEstoniaEthiopiaEuro areaEurope & Central AsiaEurope & Central Asia (excluding high income)Europe & Central Asia (IDA & IBRD countries)European UnionFinlandFragile and conflict affected situationsFranceGabonGeorgiaGermanyGhanaGibraltarGreeceGuatemalaHaitiHeavily indebted poor countries (HIPC)High incomeHondurasHong Kong SAR, ChinaHungaryIBRD onlyIcelandIDA & IBRD totalIDA blendIDA onlyIDA totalIndiaIndonesiaIran, Islamic Rep.IraqIrelandIsraelItalyJamaicaJapanJordanKazakhstanKenyaKorea, Dem. People’s Rep.Korea, Rep.KosovoKuwaitKyrgyz RepublicLate-demographic dividendLatin America & Caribbean Latin America & Caribbean (excluding high income)Latin America & the Caribbean (IDA & IBRD countries)LatviaLeast developed countries: UN classificationLebanonLibyaLithuaniaLow & middle incomeLow incomeLower middle incomeLuxembourgMacedonia, FYRMalaysiaMaltaMauritiusMexicoMiddle East & North AfricaMiddle East & North Africa (excluding high income)Middle East & North Africa (IDA & IBRD countries)Middle incomeMoldovaMongoliaMontenegroMoroccoMozambiqueMyanmarNamibiaNepalNetherlandsNew ZealandNicaraguaNigerNigeriaNorth AmericaNorwayOECD membersOmanOther small statesPakistanPanamaParaguayPeruPhilippinesPolandPortugalPost-demographic dividendPre-demographic dividendQatarRomaniaRussian FederationSaudi ArabiaSenegalSerbiaSingaporeSlovak RepublicSloveniaSmall statesSouth AfricaSouth AsiaSouth Asia (IDA & IBRD)South SudanSpainSri LankaSub-Saharan Africa Sub-Saharan Africa (excluding high income)Sub-Saharan Africa (IDA & IBRD countries)SudanSwedenSwitzerlandSyrian Arab RepublicTajikistanTanzaniaThailandTogoTrinidad and TobagoTunisiaTurkeyTurkmenistanUkraineUnited Arab EmiratesUnited KingdomUnited StatesUpper middle incomeUruguayUzbekistanVenezuela, RBVietnamWorldYemen, Rep.ZambiaZimbabwe Linea del tempo:
Questa scala temporale mostra un grafico dal 1961 anno al 2014 anno. IDA & IBRD total. I dati fino ad 1960 anno non disponibili. Il numero di osservazioni attuali secondo i date: 54.
La fonte (nome):
Indicatori dello sviluppo mondiale
La fonte (organizzazione):
IEA Statistics © OECD/IEA 2014 (http://www.iea.org/stats/index.asp), subject to https://www.iea.org/t&c/termsandconditions/
Categorie:
Environment
sono stati aggiornati
23 apr 2017 anni
Indicatori delle variazioni dei valori per anni
Minima:
7.118
1 gen 2014 anni
Massimo:
24.544
1 gen 1961 anni
Alla data di osservazione
Valore
Variazione assoluta
La variazione rispetto al valore precedente
1 gen 1961 anni
24.544
+24.544
0.0%
1 gen 1962 anni
22.694
-1.85
-7.54%
1 gen 1963 anni
22.667
-0.027
-0.12%
1 gen 1964 anni
22.309
-0.358
-1.58%
1 gen 1965 anni
21.993
-0.316
-1.42%
1 gen 1966 anni
21.352
-0.641
-2.91%
1 gen 1967 anni
19.458
-1.893
-8.87%
1 gen 1968 anni
18.51
-0.948
-4.87%
1 gen 1969 anni
17.386
-1.125
-6.08%
1 gen 1970 anni
18.914
+1.528
8.79%
1 gen 1971 anni
20.459
+1.546
8.17%
1 gen 1972 anni
15.187
-5.273
-25.77%
1 gen 1973 anni
15.107
-0.079
-0.52%
1 gen 1974 anni
14.748
-0.36
-2.38%
1 gen 1975 anni
14.509
-0.239
-1.62%
1 gen 1976 anni
14.789
+0.281
1.93%
1 gen 1977 anni
14.43
-0.359
-2.43%
1 gen 1978 anni
14.386
-0.044
-0.3%
1 gen 1979 anni
14.138
-0.249
-1.73%
1 gen 1980 anni
14.013
-0.125
-0.88%
1 gen 1981 anni
13.66
-0.353
-2.52%
1 gen 1982 anni
13.965
+0.306
2.24%
1 gen 1983 anni
14.169
+0.204
1.46%
1 gen 1984 anni
14.092
-0.077
-0.55%
1 gen 1985 anni
14.141
+0.049
0.35%
1 gen 1986 anni
14.715
+0.574
4.06%
1 gen 1987 anni
14.33
-0.385
-2.62%
1 gen 1988 anni
14.287
-0.044
-0.3%
1 gen 1989 anni
14.381
+0.094
0.66%
1 gen 1990 anni
13.925
-0.456
-3.17%
1 gen 1991 anni
12.197
-1.728
-12.41%
1 gen 1992 anni
11.913
-0.284
-2.33%
1 gen 1993 anni
11.244
-0.669
-5.62%
1 gen 1994 anni
11.468
+0.224
2.0%
1 gen 1995 anni
11.172
-0.297
-2.59%
1 gen 1996 anni
11.276
+0.105
0.94%
1 gen 1997 anni
10.657
-0.619
-5.49%
1 gen 1998 anni
11.02
+0.363
3.41%
1 gen 1999 anni
10.078
-0.942
-8.55%
1 gen 2000 anni
10.554
+0.476
4.72%
1 gen 2001 anni
10.06
-0.493
-4.68%
1 gen 2002 anni
9.889
-0.171
-1.7%
1 gen 2003 anni
9.689
-0.2
-2.02%
1 gen 2004 anni
9.275
-0.413
-4.26%
1 gen 2005 anni
9.037
-0.238
-2.57%
1 gen 2006 anni
8.697
-0.341
-3.77%
1 gen 2007 anni
8.531
-0.165
-1.9%
1 gen 2008 anni
8.398
-0.133
-1.56%
1 gen 2009 anni
8.291
-0.107
-1.28%
1 gen 2010 anni
8.053
-0.238
-2.87%
1 gen 2011 anni
7.707
-0.346
-4.29%
1 gen 2012 anni
7.43
-0.277
-3.59%
1 gen 2013 anni
7.354
-0.076
-1.02%
1 gen 2014 anni
7.118
-0.237
-3.22%
Classificazione dei paesi secondo i statistiche attuali per anni


Commenti: