29
/it/
it
AIzaSyAYiBZKx7MnpbEhh9jyipgxe19OcubqV5w
April 1, 2024
24736
Caribbean small states
CSS
false
2
1
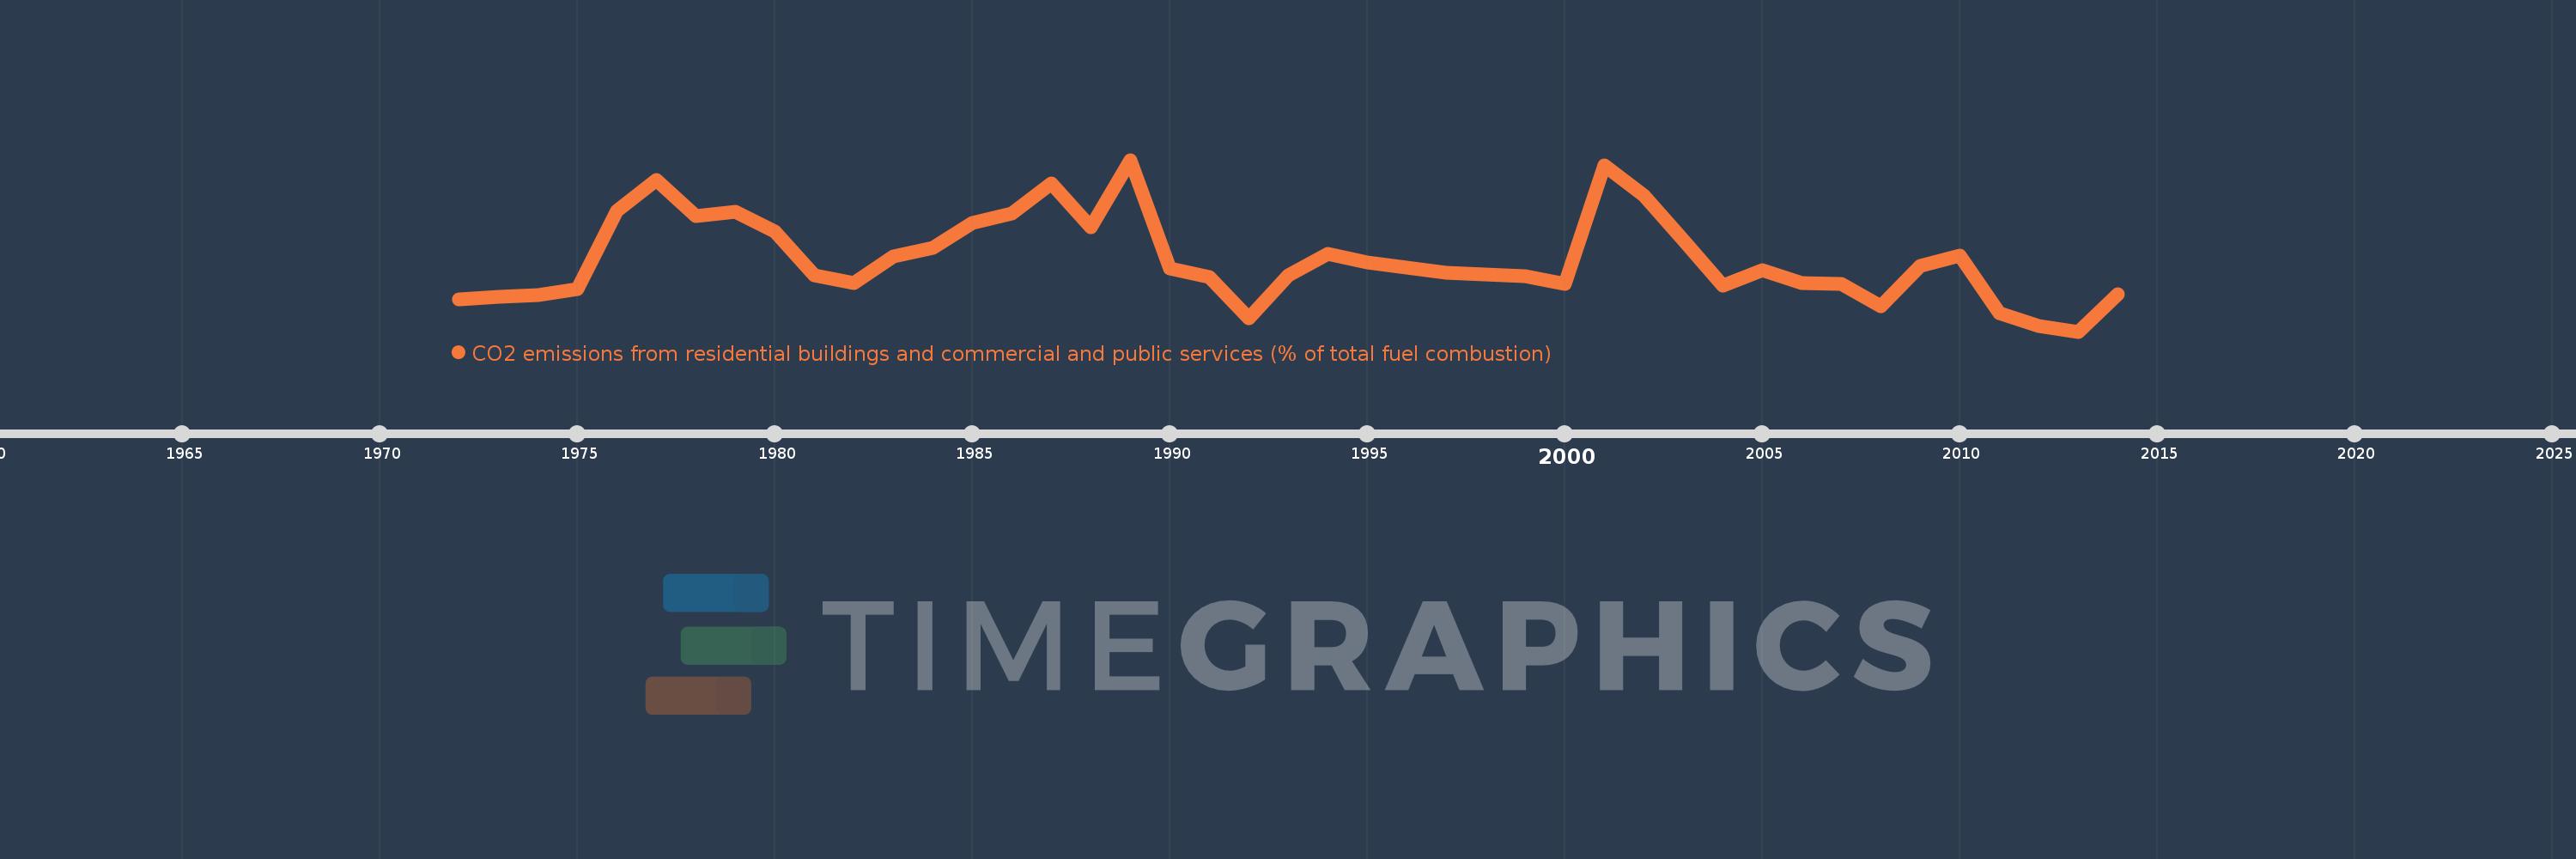
CO2 emissions from residential buildings and commercial and public services (% of total fuel combustion)
2014,2013,2012,2011,2010,2009,2008,2007,2006,2005,2004,2003,2002,2001,2000,1999,1998,1997,1996,1995,1994,1993,1992,1991,1990,1989,1988,1987,1986,1985,1984,1983,1982,1981,1980,1979,1978,1977,1976,1975,1974,1973,1972
Queste statistiche in altri paesi:
AlbaniaAlgeriaAngolaArab WorldArgentinaArmeniaAustraliaAustriaAzerbaijanBahrainBangladeshBelarusBelgiumBeninBoliviaBosnia and HerzegovinaBotswanaBrazilBrunei DarussalamBulgariaCambodiaCameroonCanadaCaribbean small statesCentral Europe and the BalticsChileChinaColombiaCongo, Dem. Rep.Congo, Rep.Costa RicaCote d'IvoireCroatiaCubaCuracaoCyprusCzech RepublicDenmarkDominican RepublicEarly-demographic dividendEast Asia & PacificEast Asia & Pacific (excluding high income)East Asia & Pacific (IDA & IBRD countries)EcuadorEgypt, Arab Rep.El SalvadorEritreaEstoniaEthiopiaEuro areaEurope & Central AsiaEurope & Central Asia (excluding high income)Europe & Central Asia (IDA & IBRD countries)European UnionFinlandFragile and conflict affected situationsFranceGabonGeorgiaGermanyGhanaGibraltarGreeceGuatemalaHaitiHeavily indebted poor countries (HIPC)High incomeHondurasHong Kong SAR, ChinaHungaryIBRD onlyIcelandIDA & IBRD totalIDA blendIDA onlyIDA totalIndiaIndonesiaIran, Islamic Rep.IraqIrelandIsraelItalyJamaicaJapanJordanKazakhstanKenyaKorea, Dem. People’s Rep.Korea, Rep.KosovoKuwaitKyrgyz RepublicLate-demographic dividendLatin America & Caribbean Latin America & Caribbean (excluding high income)Latin America & the Caribbean (IDA & IBRD countries)LatviaLeast developed countries: UN classificationLebanonLibyaLithuaniaLow & middle incomeLow incomeLower middle incomeLuxembourgMacedonia, FYRMalaysiaMaltaMauritiusMexicoMiddle East & North AfricaMiddle East & North Africa (excluding high income)Middle East & North Africa (IDA & IBRD countries)Middle incomeMoldovaMongoliaMontenegroMoroccoMozambiqueMyanmarNamibiaNepalNetherlandsNew ZealandNicaraguaNigerNigeriaNorth AmericaNorwayOECD membersOmanOther small statesPakistanPanamaParaguayPeruPhilippinesPolandPortugalPost-demographic dividendPre-demographic dividendQatarRomaniaRussian FederationSaudi ArabiaSenegalSerbiaSingaporeSlovak RepublicSloveniaSmall statesSouth AfricaSouth AsiaSouth Asia (IDA & IBRD)South SudanSpainSri LankaSub-Saharan Africa Sub-Saharan Africa (excluding high income)Sub-Saharan Africa (IDA & IBRD countries)SudanSwedenSwitzerlandSyrian Arab RepublicTajikistanTanzaniaThailandTogoTrinidad and TobagoTunisiaTurkeyTurkmenistanUkraineUnited Arab EmiratesUnited KingdomUnited StatesUpper middle incomeUruguayUzbekistanVenezuela, RBVietnamWorldYemen, Rep.ZambiaZimbabwe Linea del tempo:
Questa scala temporale mostra un grafico dal 1972 anno al 2014 anno. Caribbean small states. I dati fino ad 1971 anno non disponibili. Il numero di osservazioni attuali secondo i date: 43.
La fonte (nome):
Indicatori dello sviluppo mondiale
La fonte (organizzazione):
IEA Statistics © OECD/IEA 2014 (http://www.iea.org/stats/index.asp), subject to https://www.iea.org/t&c/termsandconditions/
Categorie:
Environment
sono stati aggiornati
23 apr 2017 anni
Indicatori delle variazioni dei valori per anni
Minima:
2.169
1 gen 2013 anni
Massimo:
4.289
1 gen 1989 anni
Alla data di osservazione
Valore
Variazione assoluta
La variazione rispetto al valore precedente
1 gen 1972 anni
2.569
+2.569
0.0%
1 gen 1973 anni
2.597
+0.029
1.11%
1 gen 1974 anni
2.622
+0.025
0.95%
1 gen 1975 anni
2.698
+0.076
2.91%
1 gen 1976 anni
3.661
+0.962
35.66%
1 gen 1977 anni
4.042
+0.382
10.42%
1 gen 1978 anni
3.599
-0.443
-10.95%
1 gen 1979 anni
3.649
+0.05
1.38%
1 gen 1980 anni
3.406
-0.243
-6.67%
1 gen 1981 anni
2.866
-0.54
-15.84%
1 gen 1982 anni
2.77
-0.096
-3.36%
1 gen 1983 anni
3.098
+0.328
11.84%
1 gen 1984 anni
3.205
+0.107
3.45%
1 gen 1985 anni
3.509
+0.304
9.49%
1 gen 1986 anni
3.622
+0.113
3.22%
1 gen 1987 anni
4.0
+0.378
10.44%
1 gen 1988 anni
3.454
-0.546
-13.65%
1 gen 1989 anni
4.289
+0.835
24.18%
1 gen 1990 anni
2.952
-1.337
-31.18%
1 gen 1991 anni
2.84
-0.112
-3.78%
1 gen 1992 anni
2.33
-0.51
-17.95%
1 gen 1993 anni
2.861
+0.53
22.76%
1 gen 1994 anni
3.131
+0.27
9.44%
1 gen 1995 anni
3.021
-0.11
-3.51%
1 gen 1996 anni
2.955
-0.066
-2.17%
1 gen 1997 anni
2.897
-0.058
-1.98%
1 gen 1998 anni
2.878
-0.019
-0.66%
1 gen 1999 anni
2.851
-0.027
-0.92%
1 gen 2000 anni
2.758
-0.094
-3.28%
1 gen 2001 anni
4.223
+1.466
53.15%
1 gen 2002 anni
3.844
-0.379
-8.97%
1 gen 2003 anni
3.3
-0.544
-14.16%
1 gen 2004 anni
2.735
-0.565
-17.11%
1 gen 2005 anni
2.923
+0.188
6.86%
1 gen 2006 anni
2.768
-0.155
-5.31%
1 gen 2007 anni
2.758
-0.01
-0.35%
1 gen 2008 anni
2.485
-0.273
-9.9%
1 gen 2009 anni
2.977
+0.492
19.8%
1 gen 2010 anni
3.108
+0.131
4.4%
1 gen 2011 anni
2.392
-0.717
-23.05%
1 gen 2012 anni
2.234
-0.158
-6.61%
1 gen 2013 anni
2.169
-0.065
-2.9%
1 gen 2014 anni
2.632
+0.463
21.35%
Classificazione dei paesi secondo i statistiche attuali per anni


Commenti: