29
/it/
it
AIzaSyAYiBZKx7MnpbEhh9jyipgxe19OcubqV5w
April 1, 2024
218083
Panama
PAN
true
2
1
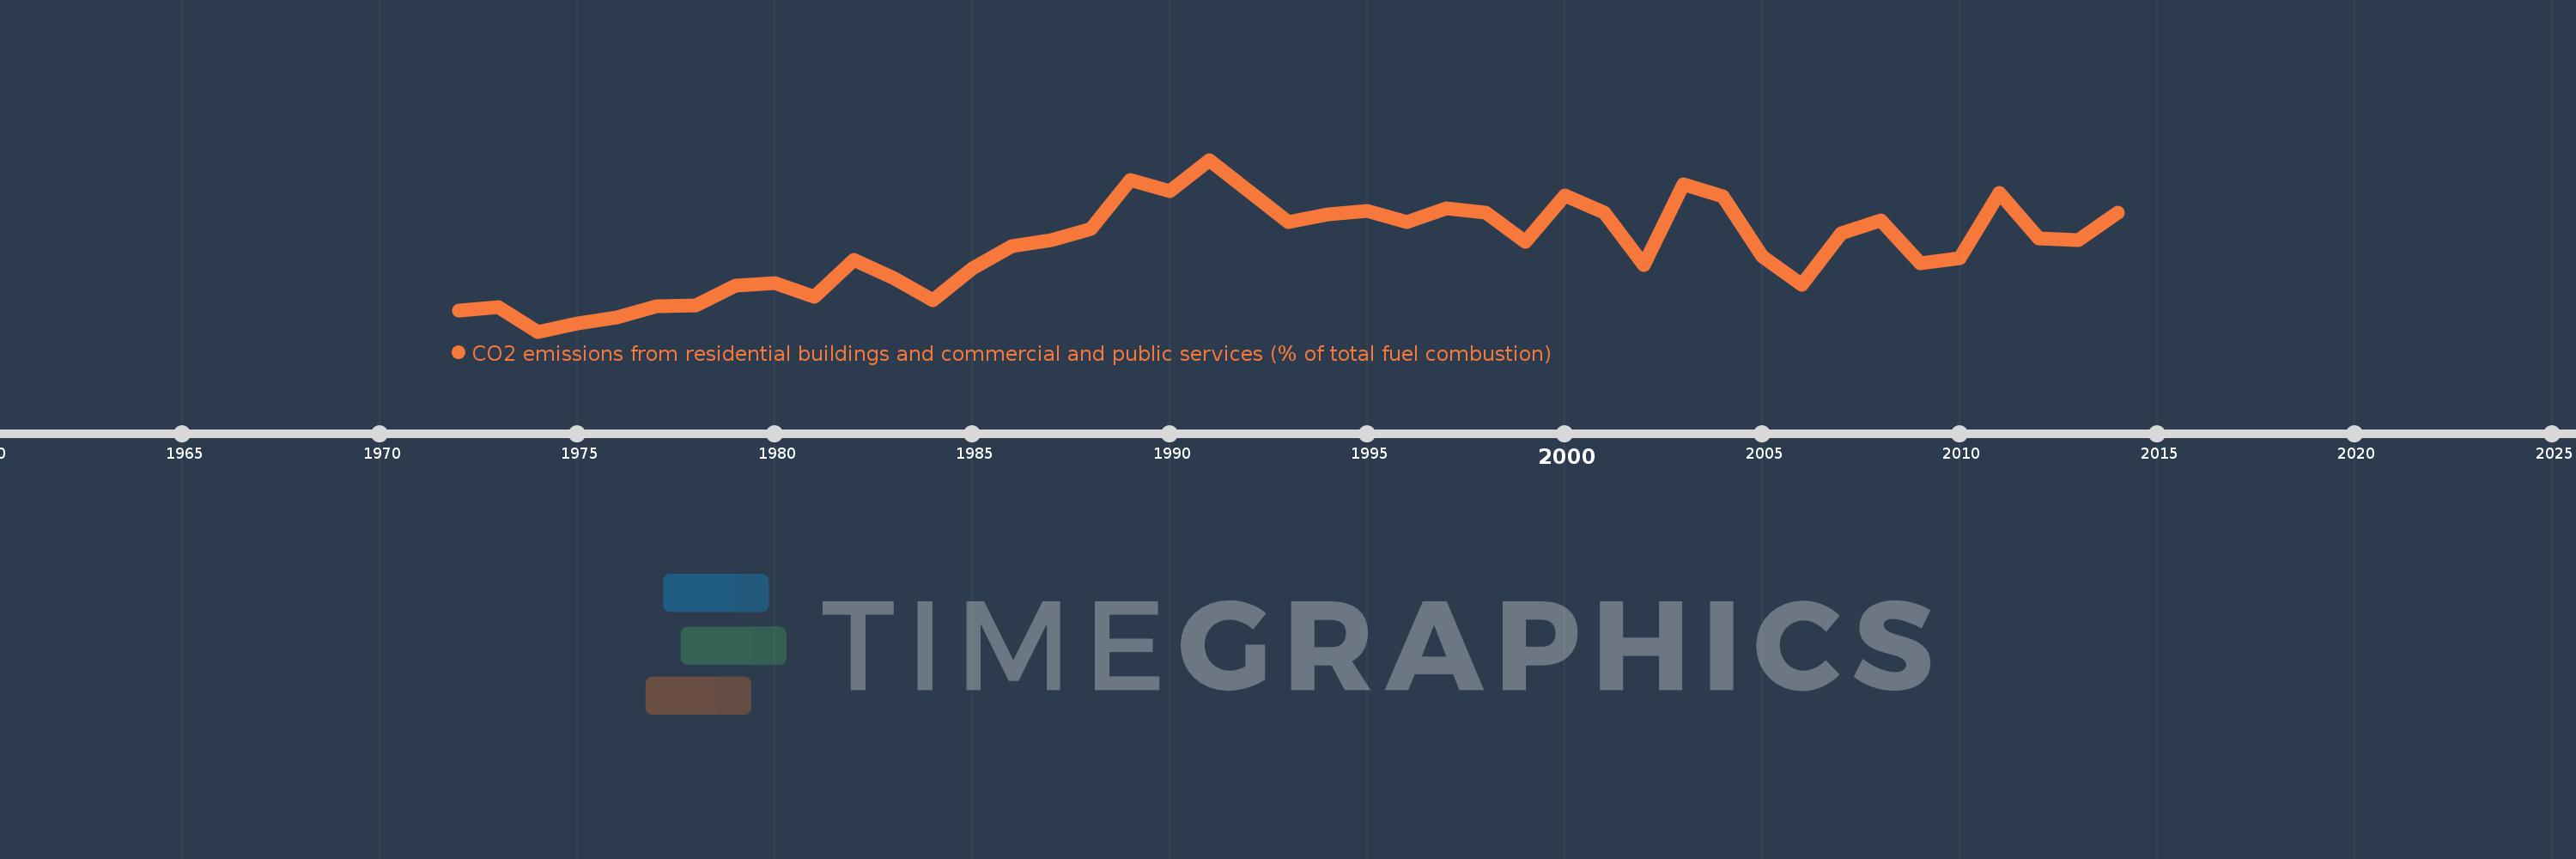
CO2 emissions from residential buildings and commercial and public services (% of total fuel combustion)
2014,2013,2012,2011,2010,2009,2008,2007,2006,2005,2004,2003,2002,2001,2000,1999,1998,1997,1996,1995,1994,1993,1992,1991,1990,1989,1988,1987,1986,1985,1984,1983,1982,1981,1980,1979,1978,1977,1976,1975,1974,1973,1972
Queste statistiche in altri paesi:
AlbaniaAlgeriaAngolaArab WorldArgentinaArmeniaAustraliaAustriaAzerbaijanBahrainBangladeshBelarusBelgiumBeninBoliviaBosnia and HerzegovinaBotswanaBrazilBrunei DarussalamBulgariaCambodiaCameroonCanadaCaribbean small statesCentral Europe and the BalticsChileChinaColombiaCongo, Dem. Rep.Congo, Rep.Costa RicaCote d'IvoireCroatiaCubaCuracaoCyprusCzech RepublicDenmarkDominican RepublicEarly-demographic dividendEast Asia & PacificEast Asia & Pacific (excluding high income)East Asia & Pacific (IDA & IBRD countries)EcuadorEgypt, Arab Rep.El SalvadorEritreaEstoniaEthiopiaEuro areaEurope & Central AsiaEurope & Central Asia (excluding high income)Europe & Central Asia (IDA & IBRD countries)European UnionFinlandFragile and conflict affected situationsFranceGabonGeorgiaGermanyGhanaGibraltarGreeceGuatemalaHaitiHeavily indebted poor countries (HIPC)High incomeHondurasHong Kong SAR, ChinaHungaryIBRD onlyIcelandIDA & IBRD totalIDA blendIDA onlyIDA totalIndiaIndonesiaIran, Islamic Rep.IraqIrelandIsraelItalyJamaicaJapanJordanKazakhstanKenyaKorea, Dem. People’s Rep.Korea, Rep.KosovoKuwaitKyrgyz RepublicLate-demographic dividendLatin America & Caribbean Latin America & Caribbean (excluding high income)Latin America & the Caribbean (IDA & IBRD countries)LatviaLeast developed countries: UN classificationLebanonLibyaLithuaniaLow & middle incomeLow incomeLower middle incomeLuxembourgMacedonia, FYRMalaysiaMaltaMauritiusMexicoMiddle East & North AfricaMiddle East & North Africa (excluding high income)Middle East & North Africa (IDA & IBRD countries)Middle incomeMoldovaMongoliaMontenegroMoroccoMozambiqueMyanmarNamibiaNepalNetherlandsNew ZealandNicaraguaNigerNigeriaNorth AmericaNorwayOECD membersOmanOther small statesPakistanPanamaParaguayPeruPhilippinesPolandPortugalPost-demographic dividendPre-demographic dividendQatarRomaniaRussian FederationSaudi ArabiaSenegalSerbiaSingaporeSlovak RepublicSloveniaSmall statesSouth AfricaSouth AsiaSouth Asia (IDA & IBRD)South SudanSpainSri LankaSub-Saharan Africa Sub-Saharan Africa (excluding high income)Sub-Saharan Africa (IDA & IBRD countries)SudanSwedenSwitzerlandSyrian Arab RepublicTajikistanTanzaniaThailandTogoTrinidad and TobagoTunisiaTurkeyTurkmenistanUkraineUnited Arab EmiratesUnited KingdomUnited StatesUpper middle incomeUruguayUzbekistanVenezuela, RBVietnamWorldYemen, Rep.ZambiaZimbabwe Linea del tempo:
Questa scala temporale mostra un grafico dal 1972 anno al 2014 anno. Panama. I dati fino ad 1971 anno non disponibili. Il numero di osservazioni attuali secondo i date: 43.
La fonte (nome):
Indicatori dello sviluppo mondiale
La fonte (organizzazione):
IEA Statistics © OECD/IEA 2014 (http://www.iea.org/stats/index.asp), subject to https://www.iea.org/t&c/termsandconditions/
Categorie:
Environment
sono stati aggiornati
23 apr 2017 anni
Indicatori delle variazioni dei valori per anni
Minima:
3.767
1 gen 1974 anni
Massimo:
8.984
1 gen 1991 anni
Alla data di osservazione
Valore
Variazione assoluta
La variazione rispetto al valore precedente
1 gen 1972 anni
4.418
+4.418
0.0%
1 gen 1973 anni
4.511
+0.094
2.12%
1 gen 1974 anni
3.767
-0.744
-16.5%
1 gen 1975 anni
4.027
+0.26
6.89%
1 gen 1976 anni
4.194
+0.167
4.14%
1 gen 1977 anni
4.531
+0.337
8.04%
1 gen 1978 anni
4.56
+0.03
0.65%
1 gen 1979 anni
5.172
+0.612
13.42%
1 gen 1980 anni
5.229
+0.056
1.09%
1 gen 1981 anni
4.811
-0.418
-7.99%
1 gen 1982 anni
5.952
+1.141
23.72%
1 gen 1983 anni
5.405
-0.547
-9.19%
1 gen 1984 anni
4.72
-0.686
-12.68%
1 gen 1985 anni
5.694
+0.974
20.64%
1 gen 1986 anni
6.367
+0.673
11.82%
1 gen 1987 anni
6.545
+0.178
2.8%
1 gen 1988 anni
6.885
+0.34
5.19%
1 gen 1989 anni
8.368
+1.483
21.54%
1 gen 1990 anni
8.032
-0.336
-4.02%
1 gen 1991 anni
8.984
+0.952
11.86%
1 gen 1992 anni
8.027
-0.958
-10.66%
1 gen 1993 anni
7.082
-0.945
-11.77%
1 gen 1994 anni
7.324
+0.242
3.41%
1 gen 1995 anni
7.427
+0.103
1.41%
1 gen 1996 anni
7.09
-0.337
-4.53%
1 gen 1997 anni
7.506
+0.416
5.86%
1 gen 1998 anni
7.373
-0.133
-1.77%
1 gen 1999 anni
6.481
-0.892
-12.09%
1 gen 2000 anni
7.889
+1.408
21.72%
1 gen 2001 anni
7.377
-0.512
-6.49%
1 gen 2002 anni
5.792
-1.585
-21.48%
1 gen 2003 anni
8.235
+2.443
42.18%
1 gen 2004 anni
7.885
-0.351
-4.26%
1 gen 2005 anni
6.049
-1.835
-23.28%
1 gen 2006 anni
5.193
-0.856
-14.16%
1 gen 2007 anni
6.742
+1.549
29.82%
1 gen 2008 anni
7.132
+0.391
5.8%
1 gen 2009 anni
5.828
-1.304
-18.29%
1 gen 2010 anni
6.0
+0.172
2.95%
1 gen 2011 anni
7.978
+1.978
32.96%
1 gen 2012 anni
6.597
-1.381
-17.31%
1 gen 2013 anni
6.537
-0.06
-0.9%
1 gen 2014 anni
7.383
+0.846
12.94%
Classificazione dei paesi secondo i statistiche attuali per anni


Commenti: