29
/it/
it
AIzaSyAYiBZKx7MnpbEhh9jyipgxe19OcubqV5w
April 1, 2024
153365
Iceland
ISL
true
2
1
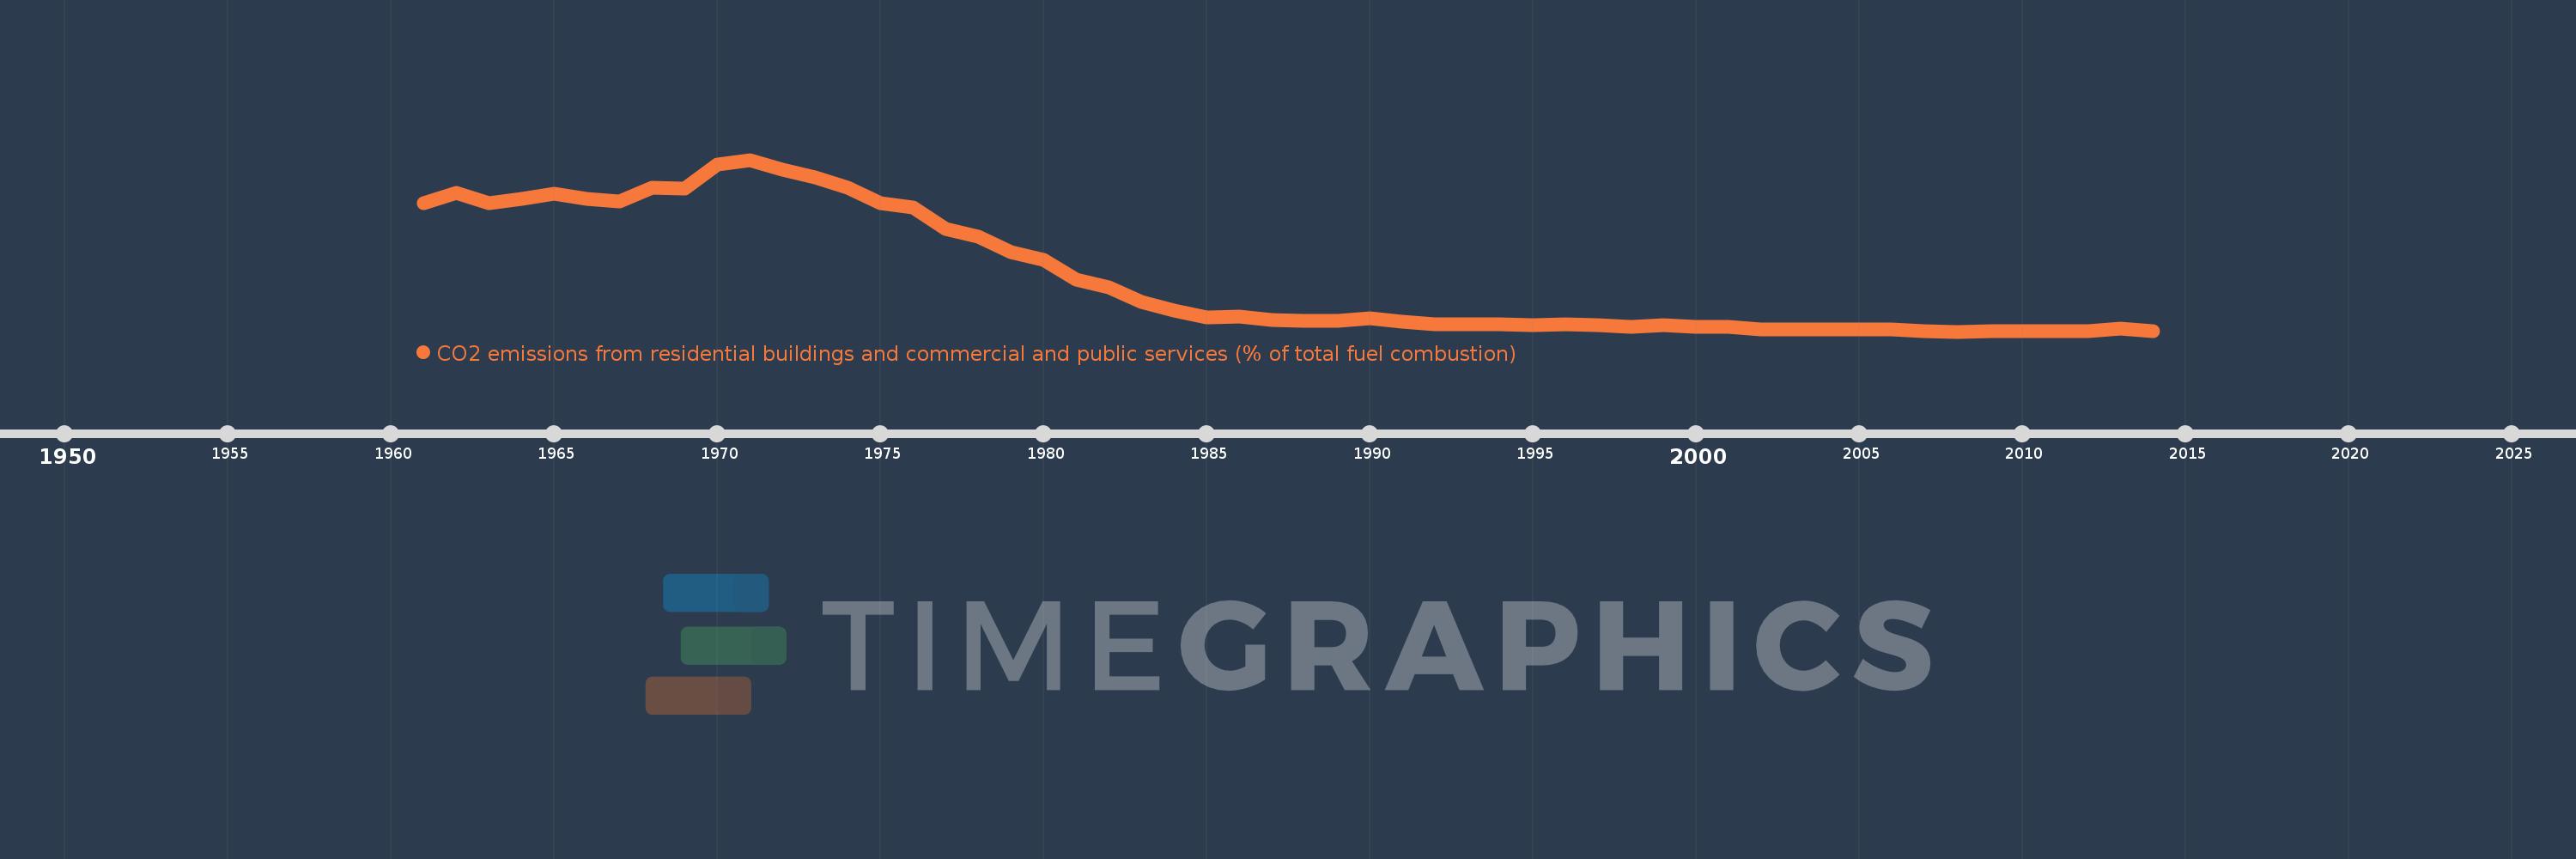
CO2 emissions from residential buildings and commercial and public services (% of total fuel combustion)
2014,2013,2012,2011,2010,2009,2008,2007,2006,2005,2004,2003,2002,2001,2000,1999,1998,1997,1996,1995,1994,1993,1992,1991,1990,1989,1988,1987,1986,1985,1984,1983,1982,1981,1980,1979,1978,1977,1976,1975,1974,1973,1972,1971,1970,1969,1968,1967,1966,1965,1964,1963,1962,1961
Queste statistiche in altri paesi:
AlbaniaAlgeriaAngolaArab WorldArgentinaArmeniaAustraliaAustriaAzerbaijanBahrainBangladeshBelarusBelgiumBeninBoliviaBosnia and HerzegovinaBotswanaBrazilBrunei DarussalamBulgariaCambodiaCameroonCanadaCaribbean small statesCentral Europe and the BalticsChileChinaColombiaCongo, Dem. Rep.Congo, Rep.Costa RicaCote d'IvoireCroatiaCubaCuracaoCyprusCzech RepublicDenmarkDominican RepublicEarly-demographic dividendEast Asia & PacificEast Asia & Pacific (excluding high income)East Asia & Pacific (IDA & IBRD countries)EcuadorEgypt, Arab Rep.El SalvadorEritreaEstoniaEthiopiaEuro areaEurope & Central AsiaEurope & Central Asia (excluding high income)Europe & Central Asia (IDA & IBRD countries)European UnionFinlandFragile and conflict affected situationsFranceGabonGeorgiaGermanyGhanaGibraltarGreeceGuatemalaHaitiHeavily indebted poor countries (HIPC)High incomeHondurasHong Kong SAR, ChinaHungaryIBRD onlyIcelandIDA & IBRD totalIDA blendIDA onlyIDA totalIndiaIndonesiaIran, Islamic Rep.IraqIrelandIsraelItalyJamaicaJapanJordanKazakhstanKenyaKorea, Dem. People’s Rep.Korea, Rep.KosovoKuwaitKyrgyz RepublicLate-demographic dividendLatin America & Caribbean Latin America & Caribbean (excluding high income)Latin America & the Caribbean (IDA & IBRD countries)LatviaLeast developed countries: UN classificationLebanonLibyaLithuaniaLow & middle incomeLow incomeLower middle incomeLuxembourgMacedonia, FYRMalaysiaMaltaMauritiusMexicoMiddle East & North AfricaMiddle East & North Africa (excluding high income)Middle East & North Africa (IDA & IBRD countries)Middle incomeMoldovaMongoliaMontenegroMoroccoMozambiqueMyanmarNamibiaNepalNetherlandsNew ZealandNicaraguaNigerNigeriaNorth AmericaNorwayOECD membersOmanOther small statesPakistanPanamaParaguayPeruPhilippinesPolandPortugalPost-demographic dividendPre-demographic dividendQatarRomaniaRussian FederationSaudi ArabiaSenegalSerbiaSingaporeSlovak RepublicSloveniaSmall statesSouth AfricaSouth AsiaSouth Asia (IDA & IBRD)South SudanSpainSri LankaSub-Saharan Africa Sub-Saharan Africa (excluding high income)Sub-Saharan Africa (IDA & IBRD countries)SudanSwedenSwitzerlandSyrian Arab RepublicTajikistanTanzaniaThailandTogoTrinidad and TobagoTunisiaTurkeyTurkmenistanUkraineUnited Arab EmiratesUnited KingdomUnited StatesUpper middle incomeUruguayUzbekistanVenezuela, RBVietnamWorldYemen, Rep.ZambiaZimbabwe Linea del tempo:
Questa scala temporale mostra un grafico dal 1961 anno al 2014 anno. Iceland. I dati fino ad 1960 anno non disponibili. Il numero di osservazioni attuali secondo i date: 54.
La fonte (nome):
Indicatori dello sviluppo mondiale
La fonte (organizzazione):
IEA Statistics © OECD/IEA 2014 (http://www.iea.org/stats/index.asp), subject to https://www.iea.org/t&c/termsandconditions/
Categorie:
Environment
sono stati aggiornati
23 apr 2017 anni
Indicatori delle variazioni dei valori per anni
Minima:
0.431
1 gen 2008 anni
Massimo:
38.636
1 gen 1971 anni
Alla data di osservazione
Valore
Variazione assoluta
La variazione rispetto al valore precedente
1 gen 1961 anni
29.06
+29.06
0.0%
1 gen 1962 anni
31.304
+2.245
7.72%
1 gen 1963 anni
29.032
-2.272
-7.26%
1 gen 1964 anni
29.921
+0.889
3.06%
1 gen 1965 anni
31.008
+1.086
3.63%
1 gen 1966 anni
30.0
-1.008
-3.25%
1 gen 1967 anni
29.333
-0.667
-2.22%
1 gen 1968 anni
32.394
+3.061
10.44%
1 gen 1969 anni
32.215
-0.18
-0.55%
1 gen 1970 anni
37.594
+5.379
16.7%
1 gen 1971 anni
38.636
+1.042
2.77%
1 gen 1972 anni
36.429
-2.208
-5.71%
1 gen 1973 anni
34.667
-1.762
-4.84%
1 gen 1974 anni
32.335
-2.331
-6.73%
1 gen 1975 anni
28.916
-3.42
-10.58%
1 gen 1976 anni
27.95
-0.965
-3.34%
1 gen 1977 anni
23.27
-4.68
-16.74%
1 gen 1978 anni
21.472
-1.798
-7.73%
1 gen 1979 anni
18.182
-3.291
-15.32%
1 gen 1980 anni
16.393
-1.788
-9.84%
1 gen 1981 anni
12.0
-4.393
-26.8%
1 gen 1982 anni
10.345
-1.655
-13.79%
1 gen 1983 anni
7.051
-3.294
-31.84%
1 gen 1984 anni
5.031
-2.02
-28.64%
1 gen 1985 anni
3.55
-1.481
-29.44%
1 gen 1986 anni
3.681
+0.131
3.68%
1 gen 1987 anni
2.941
-0.74
-20.1%
1 gen 1988 anni
2.874
-0.068
-2.3%
1 gen 1989 anni
2.732
-0.141
-4.92%
1 gen 1990 anni
3.297
+0.564
20.66%
1 gen 1991 anni
2.632
-0.665
-20.18%
1 gen 1992 anni
2.139
-0.493
-18.72%
1 gen 1993 anni
2.105
-0.034
-1.58%
1 gen 1994 anni
2.062
-0.043
-2.06%
1 gen 1995 anni
1.951
-0.111
-5.37%
1 gen 1996 anni
2.041
+0.09
4.59%
1 gen 1997 anni
1.794
-0.247
-12.11%
1 gen 1998 anni
1.422
-0.372
-20.73%
1 gen 1999 anni
1.905
+0.483
33.97%
1 gen 2000 anni
1.463
-0.441
-23.17%
1 gen 2001 anni
1.389
-0.075
-5.09%
1 gen 2002 anni
0.952
-0.437
-31.43%
1 gen 2003 anni
0.909
-0.043
-4.55%
1 gen 2004 anni
0.913
+0.004
0.46%
1 gen 2005 anni
0.881
-0.032
-3.52%
1 gen 2006 anni
0.897
+0.016
1.79%
1 gen 2007 anni
0.441
-0.456
-50.88%
1 gen 2008 anni
0.431
-0.009
-2.16%
1 gen 2009 anni
0.472
+0.041
9.43%
1 gen 2010 anni
0.481
+0.009
1.92%
1 gen 2011 anni
0.513
+0.032
6.67%
1 gen 2012 anni
0.535
+0.022
4.28%
1 gen 2013 anni
1.075
+0.541
101.08%
1 gen 2014 anni
0.493
-0.583
-54.19%
Classificazione dei paesi secondo i statistiche attuali per anni


Commenti: