29
/it/
it
AIzaSyAYiBZKx7MnpbEhh9jyipgxe19OcubqV5w
April 1, 2024
140118
Ghana
GHA
true
2
1
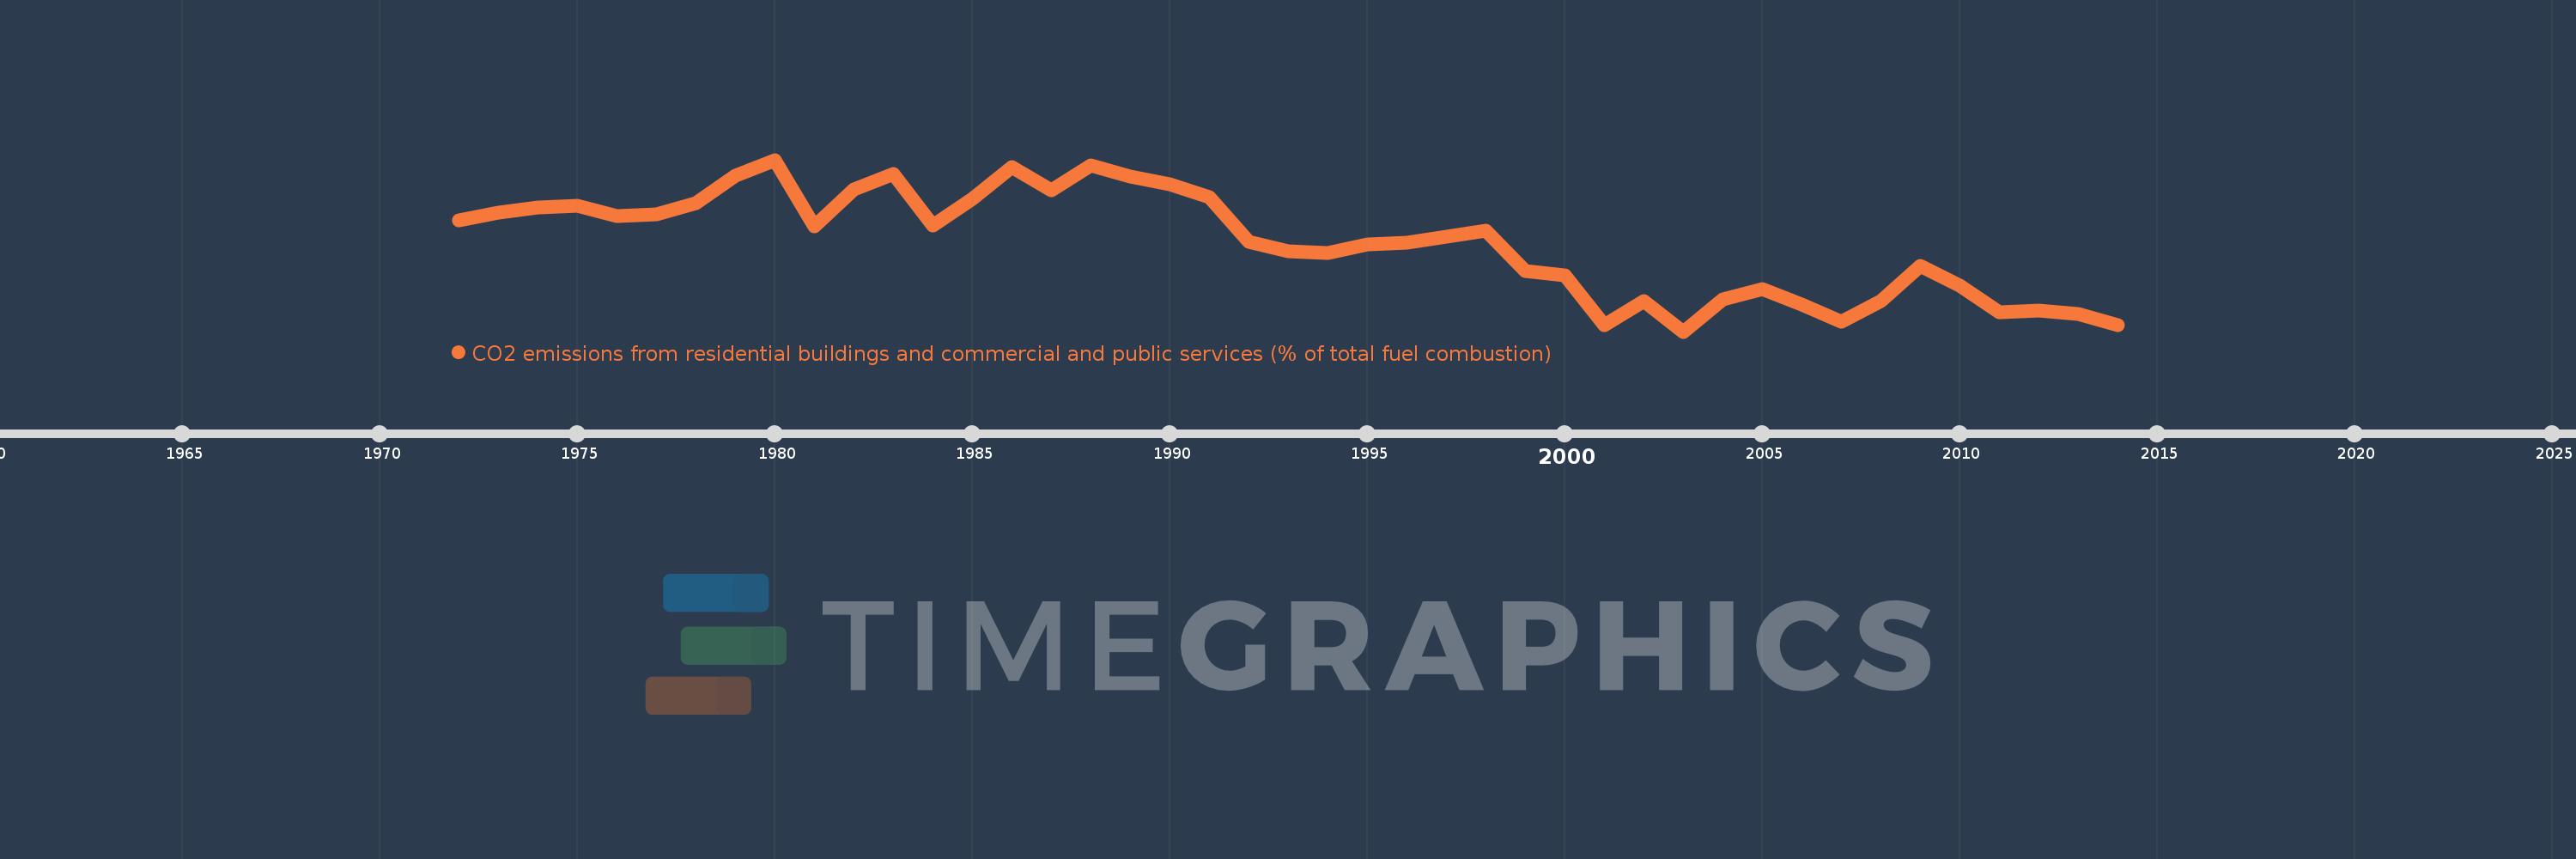
CO2 emissions from residential buildings and commercial and public services (% of total fuel combustion)
2014,2013,2012,2011,2010,2009,2008,2007,2006,2005,2004,2003,2002,2001,2000,1999,1998,1997,1996,1995,1994,1993,1992,1991,1990,1989,1988,1987,1986,1985,1984,1983,1982,1981,1980,1979,1978,1977,1976,1975,1974,1973,1972
Queste statistiche in altri paesi:
AlbaniaAlgeriaAngolaArab WorldArgentinaArmeniaAustraliaAustriaAzerbaijanBahrainBangladeshBelarusBelgiumBeninBoliviaBosnia and HerzegovinaBotswanaBrazilBrunei DarussalamBulgariaCambodiaCameroonCanadaCaribbean small statesCentral Europe and the BalticsChileChinaColombiaCongo, Dem. Rep.Congo, Rep.Costa RicaCote d'IvoireCroatiaCubaCuracaoCyprusCzech RepublicDenmarkDominican RepublicEarly-demographic dividendEast Asia & PacificEast Asia & Pacific (excluding high income)East Asia & Pacific (IDA & IBRD countries)EcuadorEgypt, Arab Rep.El SalvadorEritreaEstoniaEthiopiaEuro areaEurope & Central AsiaEurope & Central Asia (excluding high income)Europe & Central Asia (IDA & IBRD countries)European UnionFinlandFragile and conflict affected situationsFranceGabonGeorgiaGermanyGhanaGibraltarGreeceGuatemalaHaitiHeavily indebted poor countries (HIPC)High incomeHondurasHong Kong SAR, ChinaHungaryIBRD onlyIcelandIDA & IBRD totalIDA blendIDA onlyIDA totalIndiaIndonesiaIran, Islamic Rep.IraqIrelandIsraelItalyJamaicaJapanJordanKazakhstanKenyaKorea, Dem. People’s Rep.Korea, Rep.KosovoKuwaitKyrgyz RepublicLate-demographic dividendLatin America & Caribbean Latin America & Caribbean (excluding high income)Latin America & the Caribbean (IDA & IBRD countries)LatviaLeast developed countries: UN classificationLebanonLibyaLithuaniaLow & middle incomeLow incomeLower middle incomeLuxembourgMacedonia, FYRMalaysiaMaltaMauritiusMexicoMiddle East & North AfricaMiddle East & North Africa (excluding high income)Middle East & North Africa (IDA & IBRD countries)Middle incomeMoldovaMongoliaMontenegroMoroccoMozambiqueMyanmarNamibiaNepalNetherlandsNew ZealandNicaraguaNigerNigeriaNorth AmericaNorwayOECD membersOmanOther small statesPakistanPanamaParaguayPeruPhilippinesPolandPortugalPost-demographic dividendPre-demographic dividendQatarRomaniaRussian FederationSaudi ArabiaSenegalSerbiaSingaporeSlovak RepublicSloveniaSmall statesSouth AfricaSouth AsiaSouth Asia (IDA & IBRD)South SudanSpainSri LankaSub-Saharan Africa Sub-Saharan Africa (excluding high income)Sub-Saharan Africa (IDA & IBRD countries)SudanSwedenSwitzerlandSyrian Arab RepublicTajikistanTanzaniaThailandTogoTrinidad and TobagoTunisiaTurkeyTurkmenistanUkraineUnited Arab EmiratesUnited KingdomUnited StatesUpper middle incomeUruguayUzbekistanVenezuela, RBVietnamWorldYemen, Rep.ZambiaZimbabwe Linea del tempo:
Questa scala temporale mostra un grafico dal 1972 anno al 2014 anno. Ghana. I dati fino ad 1971 anno non disponibili. Il numero di osservazioni attuali secondo i date: 43.
La fonte (nome):
Indicatori dello sviluppo mondiale
La fonte (organizzazione):
IEA Statistics © OECD/IEA 2014 (http://www.iea.org/stats/index.asp), subject to https://www.iea.org/t&c/termsandconditions/
Categorie:
Environment
sono stati aggiornati
23 apr 2017 anni
Indicatori delle variazioni dei valori per anni
Minima:
4.783
1 gen 2003 anni
Massimo:
20.814
1 gen 1980 anni
Alla data di osservazione
Valore
Variazione assoluta
La variazione rispetto al valore precedente
1 gen 1972 anni
15.183
+15.183
0.0%
1 gen 1973 anni
15.92
+0.737
4.86%
1 gen 1974 anni
16.346
+0.426
2.67%
1 gen 1975 anni
16.514
+0.168
1.03%
1 gen 1976 anni
15.584
-0.929
-5.63%
1 gen 1977 anni
15.745
+0.16
1.03%
1 gen 1978 anni
16.733
+0.988
6.28%
1 gen 1979 anni
19.368
+2.635
15.74%
1 gen 1980 anni
20.814
+1.447
7.47%
1 gen 1981 anni
14.612
-6.203
-29.8%
1 gen 1982 anni
18.081
+3.469
23.74%
1 gen 1983 anni
19.481
+1.399
7.74%
1 gen 1984 anni
14.667
-4.814
-24.71%
1 gen 1985 anni
17.127
+2.46
16.78%
1 gen 1986 anni
20.096
+2.969
17.33%
1 gen 1987 anni
17.937
-2.158
-10.74%
1 gen 1988 anni
20.259
+2.321
12.94%
1 gen 1989 anni
19.247
-1.012
-4.99%
1 gen 1990 anni
18.561
-0.686
-3.57%
1 gen 1991 anni
17.323
-1.238
-6.67%
1 gen 1992 anni
13.158
-4.165
-24.04%
1 gen 1993 anni
12.313
-0.844
-6.42%
1 gen 1994 anni
12.132
-0.181
-1.47%
1 gen 1995 anni
12.925
+0.793
6.53%
1 gen 1996 anni
13.084
+0.159
1.23%
1 gen 1997 anni
13.675
+0.591
4.52%
1 gen 1998 anni
14.167
+0.491
3.59%
1 gen 1999 anni
10.44
-3.727
-26.31%
1 gen 2000 anni
10.068
-0.371
-3.56%
1 gen 2001 anni
5.422
-4.647
-46.15%
1 gen 2002 anni
7.664
+2.243
41.36%
1 gen 2003 anni
4.783
-2.881
-37.59%
1 gen 2004 anni
7.8
+3.017
63.08%
1 gen 2005 anni
8.784
+0.983
12.61%
1 gen 2006 anni
7.344
-1.44
-16.39%
1 gen 2007 anni
5.677
-1.666
-22.69%
1 gen 2008 anni
7.628
+1.951
34.36%
1 gen 2009 anni
10.954
+3.325
43.59%
1 gen 2010 anni
9.081
-1.873
-17.1%
1 gen 2011 anni
6.603
-2.478
-27.29%
1 gen 2012 anni
6.747
+0.144
2.18%
1 gen 2013 anni
6.421
-0.325
-4.82%
1 gen 2014 anni
5.348
-1.073
-16.71%
Classificazione dei paesi secondo i statistiche attuali per anni


Commenti: