29
/it/
it
AIzaSyAYiBZKx7MnpbEhh9jyipgxe19OcubqV5w
April 1, 2024
269078
Turkey
TUR
true
2
1
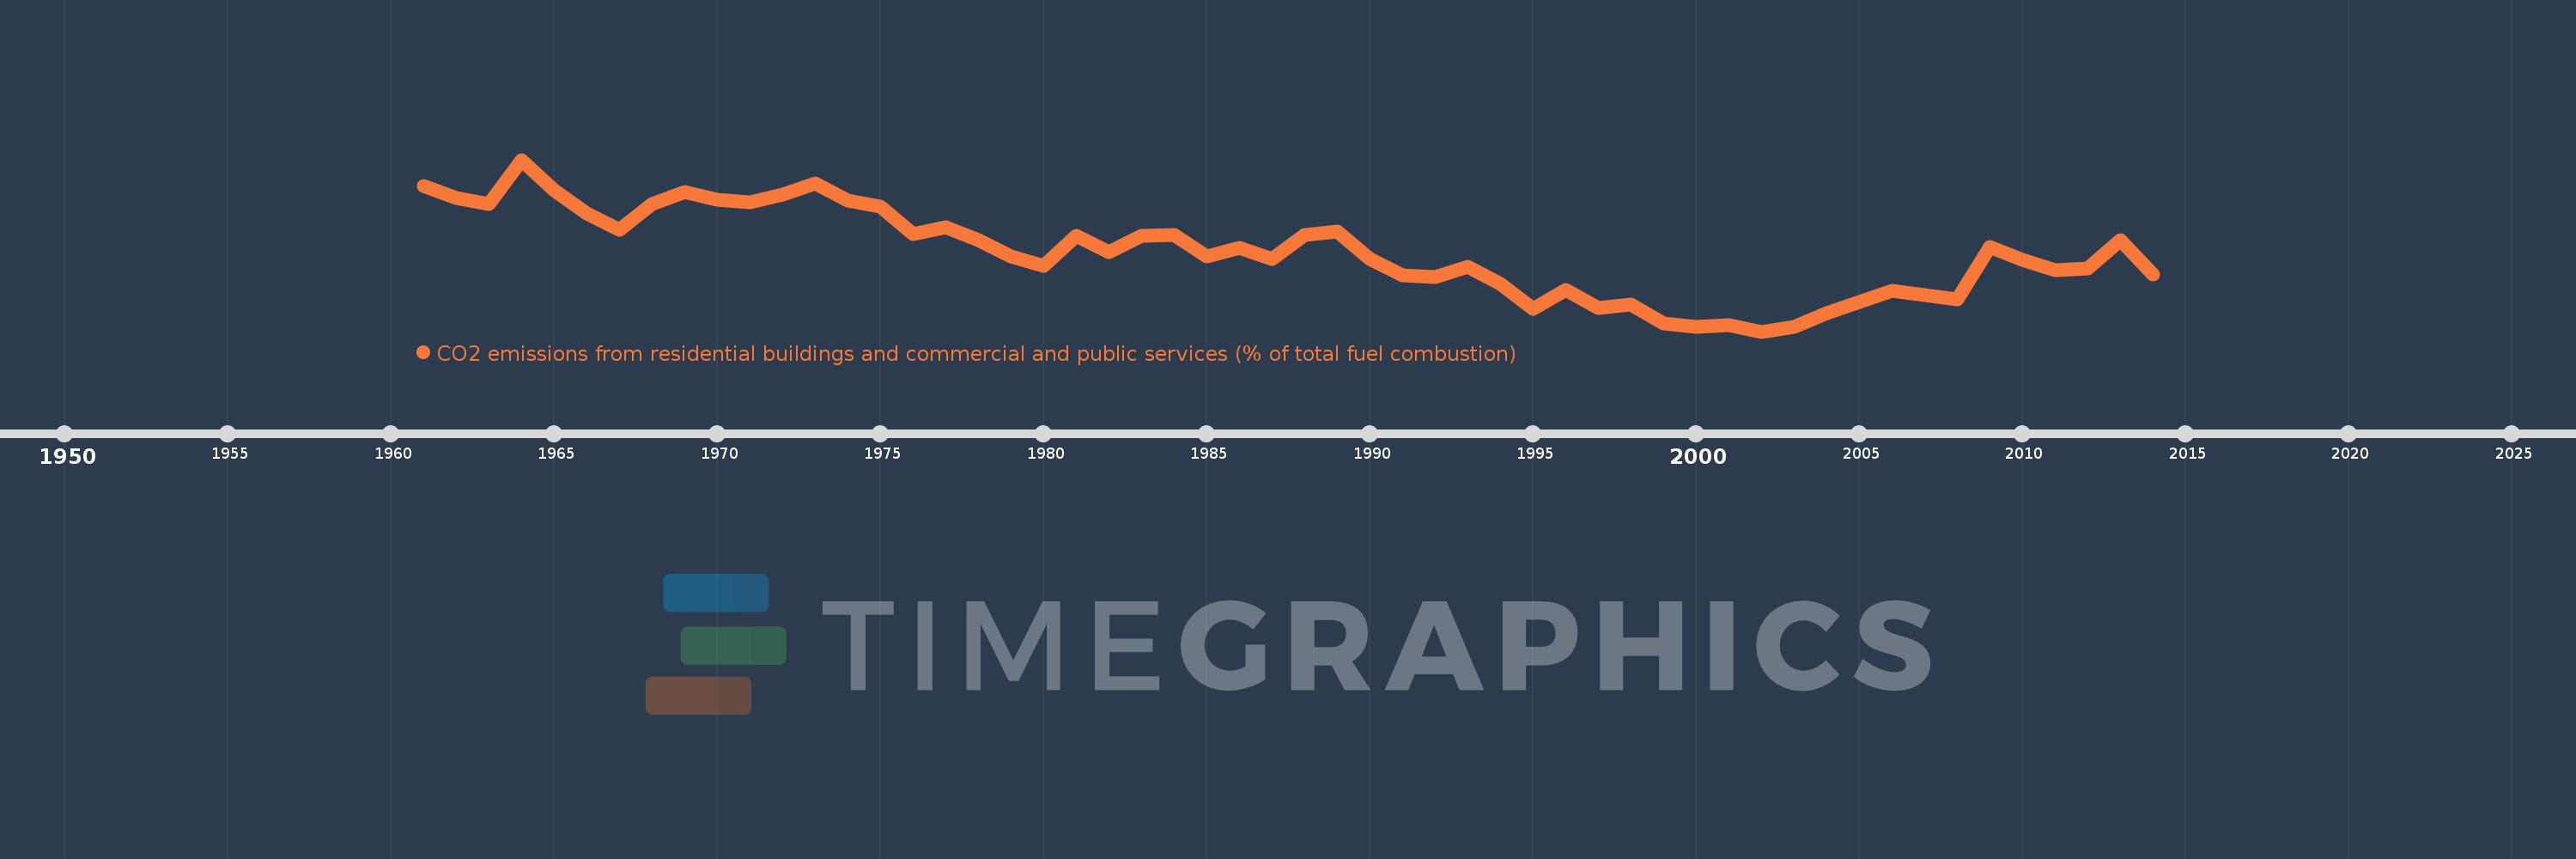
CO2 emissions from residential buildings and commercial and public services (% of total fuel combustion)
2014,2013,2012,2011,2010,2009,2008,2007,2006,2005,2004,2003,2002,2001,2000,1999,1998,1997,1996,1995,1994,1993,1992,1991,1990,1989,1988,1987,1986,1985,1984,1983,1982,1981,1980,1979,1978,1977,1976,1975,1974,1973,1972,1971,1970,1969,1968,1967,1966,1965,1964,1963,1962,1961
Queste statistiche in altri paesi:
AlbaniaAlgeriaAngolaArab WorldArgentinaArmeniaAustraliaAustriaAzerbaijanBahrainBangladeshBelarusBelgiumBeninBoliviaBosnia and HerzegovinaBotswanaBrazilBrunei DarussalamBulgariaCambodiaCameroonCanadaCaribbean small statesCentral Europe and the BalticsChileChinaColombiaCongo, Dem. Rep.Congo, Rep.Costa RicaCote d'IvoireCroatiaCubaCuracaoCyprusCzech RepublicDenmarkDominican RepublicEarly-demographic dividendEast Asia & PacificEast Asia & Pacific (excluding high income)East Asia & Pacific (IDA & IBRD countries)EcuadorEgypt, Arab Rep.El SalvadorEritreaEstoniaEthiopiaEuro areaEurope & Central AsiaEurope & Central Asia (excluding high income)Europe & Central Asia (IDA & IBRD countries)European UnionFinlandFragile and conflict affected situationsFranceGabonGeorgiaGermanyGhanaGibraltarGreeceGuatemalaHaitiHeavily indebted poor countries (HIPC)High incomeHondurasHong Kong SAR, ChinaHungaryIBRD onlyIcelandIDA & IBRD totalIDA blendIDA onlyIDA totalIndiaIndonesiaIran, Islamic Rep.IraqIrelandIsraelItalyJamaicaJapanJordanKazakhstanKenyaKorea, Dem. People’s Rep.Korea, Rep.KosovoKuwaitKyrgyz RepublicLate-demographic dividendLatin America & Caribbean Latin America & Caribbean (excluding high income)Latin America & the Caribbean (IDA & IBRD countries)LatviaLeast developed countries: UN classificationLebanonLibyaLithuaniaLow & middle incomeLow incomeLower middle incomeLuxembourgMacedonia, FYRMalaysiaMaltaMauritiusMexicoMiddle East & North AfricaMiddle East & North Africa (excluding high income)Middle East & North Africa (IDA & IBRD countries)Middle incomeMoldovaMongoliaMontenegroMoroccoMozambiqueMyanmarNamibiaNepalNetherlandsNew ZealandNicaraguaNigerNigeriaNorth AmericaNorwayOECD membersOmanOther small statesPakistanPanamaParaguayPeruPhilippinesPolandPortugalPost-demographic dividendPre-demographic dividendQatarRomaniaRussian FederationSaudi ArabiaSenegalSerbiaSingaporeSlovak RepublicSloveniaSmall statesSouth AfricaSouth AsiaSouth Asia (IDA & IBRD)South SudanSpainSri LankaSub-Saharan Africa Sub-Saharan Africa (excluding high income)Sub-Saharan Africa (IDA & IBRD countries)SudanSwedenSwitzerlandSyrian Arab RepublicTajikistanTanzaniaThailandTogoTrinidad and TobagoTunisiaTurkeyTurkmenistanUkraineUnited Arab EmiratesUnited KingdomUnited StatesUpper middle incomeUruguayUzbekistanVenezuela, RBVietnamWorldYemen, Rep.ZambiaZimbabwe Linea del tempo:
Questa scala temporale mostra un grafico dal 1961 anno al 2014 anno. Turkey. I dati fino ad 1960 anno non disponibili. Il numero di osservazioni attuali secondo i date: 54.
La fonte (nome):
Indicatori dello sviluppo mondiale
La fonte (organizzazione):
IEA Statistics © OECD/IEA 2014 (http://www.iea.org/stats/index.asp), subject to https://www.iea.org/t&c/termsandconditions/
Categorie:
Environment
sono stati aggiornati
23 apr 2017 anni
Indicatori delle variazioni dei valori per anni
Minima:
12.121
1 gen 2002 anni
Massimo:
27.058
1 gen 1964 anni
Alla data di osservazione
Valore
Variazione assoluta
La variazione rispetto al valore precedente
1 gen 1961 anni
24.806
+24.806
0.0%
1 gen 1962 anni
23.705
-1.101
-4.44%
1 gen 1963 anni
23.206
-0.499
-2.11%
1 gen 1964 anni
27.058
+3.852
16.6%
1 gen 1965 anni
24.415
-2.642
-9.77%
1 gen 1966 anni
22.396
-2.019
-8.27%
1 gen 1967 anni
20.954
-1.442
-6.44%
1 gen 1968 anni
23.225
+2.271
10.84%
1 gen 1969 anni
24.24
+1.014
4.37%
1 gen 1970 anni
23.603
-0.636
-2.63%
1 gen 1971 anni
23.378
-0.225
-0.95%
1 gen 1972 anni
24.059
+0.681
2.91%
1 gen 1973 anni
25.015
+0.956
3.97%
1 gen 1974 anni
23.488
-1.527
-6.1%
1 gen 1975 anni
23.002
-0.486
-2.07%
1 gen 1976 anni
20.577
-2.425
-10.54%
1 gen 1977 anni
21.164
+0.587
2.85%
1 gen 1978 anni
20.064
-1.1
-5.2%
1 gen 1979 anni
18.677
-1.386
-6.91%
1 gen 1980 anni
17.806
-0.871
-4.66%
1 gen 1981 anni
20.425
+2.619
14.71%
1 gen 1982 anni
19.019
-1.406
-6.88%
1 gen 1983 anni
20.443
+1.425
7.49%
1 gen 1984 anni
20.531
+0.087
0.43%
1 gen 1985 anni
18.657
-1.873
-9.12%
1 gen 1986 anni
19.394
+0.737
3.95%
1 gen 1987 anni
18.423
-0.971
-5.01%
1 gen 1988 anni
20.524
+2.101
11.4%
1 gen 1989 anni
20.816
+0.293
1.43%
1 gen 1990 anni
18.418
-2.398
-11.52%
1 gen 1991 anni
16.998
-1.42
-7.71%
1 gen 1992 anni
16.843
-0.155
-0.91%
1 gen 1993 anni
17.733
+0.89
5.28%
1 gen 1994 anni
16.258
-1.475
-8.32%
1 gen 1995 anni
14.116
-2.141
-13.17%
1 gen 1996 anni
15.749
+1.633
11.56%
1 gen 1997 anni
14.178
-1.571
-9.98%
1 gen 1998 anni
14.496
+0.319
2.25%
1 gen 1999 anni
12.832
-1.664
-11.48%
1 gen 2000 anni
12.521
-0.311
-2.42%
1 gen 2001 anni
12.711
+0.19
1.52%
1 gen 2002 anni
12.121
-0.59
-4.64%
1 gen 2003 anni
12.558
+0.436
3.6%
1 gen 2004 anni
13.764
+1.206
9.6%
1 gen 2005 anni
14.709
+0.945
6.87%
1 gen 2006 anni
15.662
+0.953
6.48%
1 gen 2007 anni
15.326
-0.336
-2.14%
1 gen 2008 anni
14.928
-0.398
-2.6%
1 gen 2009 anni
19.46
+4.532
30.36%
1 gen 2010 anni
18.335
-1.125
-5.78%
1 gen 2011 anni
17.428
-0.907
-4.95%
1 gen 2012 anni
17.574
+0.147
0.84%
1 gen 2013 anni
20.111
+2.537
14.43%
1 gen 2014 anni
17.094
-3.017
-15.0%
Classificazione dei paesi secondo i statistiche attuali per anni


Commenti: