29
/it/
it
AIzaSyAYiBZKx7MnpbEhh9jyipgxe19OcubqV5w
April 1, 2024
209136
New Zealand
NZL
true
2
1
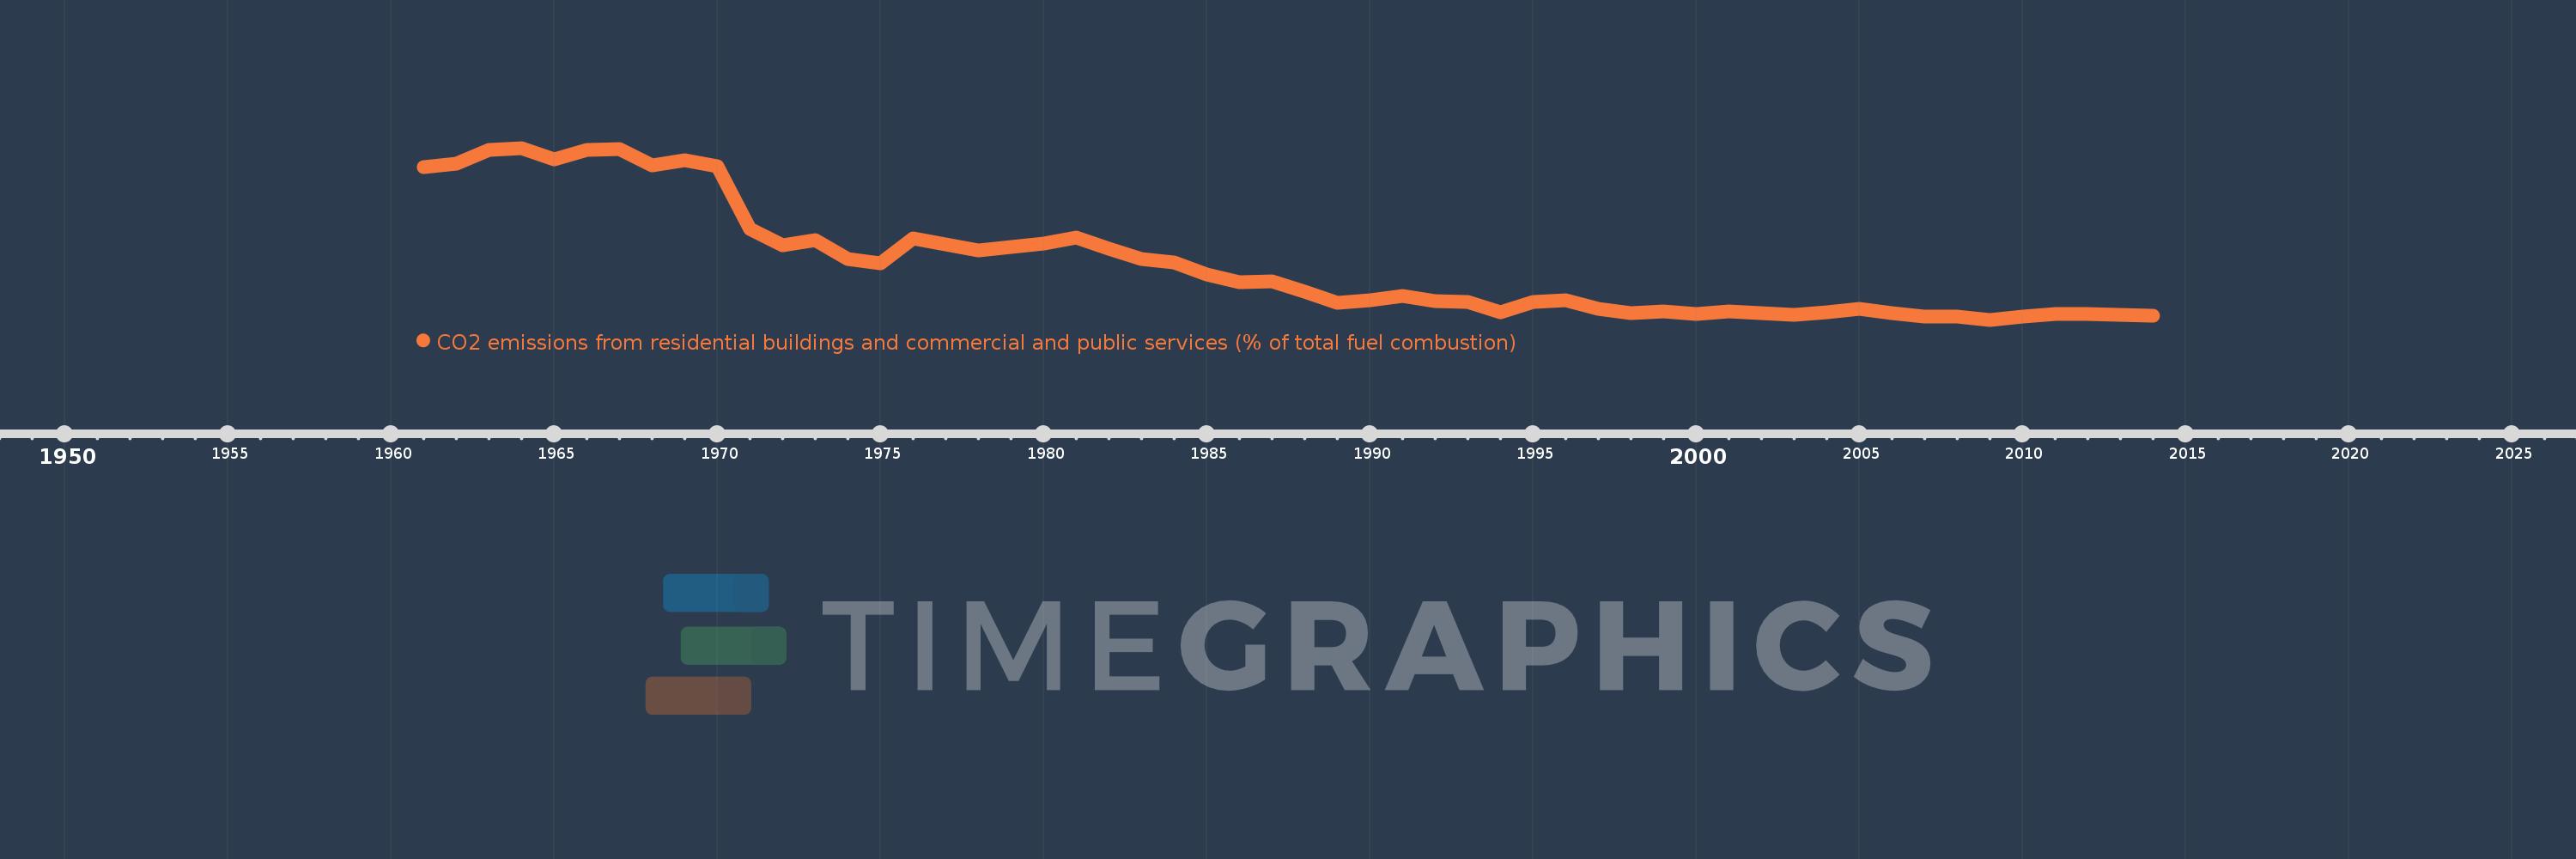
CO2 emissions from residential buildings and commercial and public services (% of total fuel combustion)
2014,2013,2012,2011,2010,2009,2008,2007,2006,2005,2004,2003,2002,2001,2000,1999,1998,1997,1996,1995,1994,1993,1992,1991,1990,1989,1988,1987,1986,1985,1984,1983,1982,1981,1980,1979,1978,1977,1976,1975,1974,1973,1972,1971,1970,1969,1968,1967,1966,1965,1964,1963,1962,1961
Queste statistiche in altri paesi:
AlbaniaAlgeriaAngolaArab WorldArgentinaArmeniaAustraliaAustriaAzerbaijanBahrainBangladeshBelarusBelgiumBeninBoliviaBosnia and HerzegovinaBotswanaBrazilBrunei DarussalamBulgariaCambodiaCameroonCanadaCaribbean small statesCentral Europe and the BalticsChileChinaColombiaCongo, Dem. Rep.Congo, Rep.Costa RicaCote d'IvoireCroatiaCubaCuracaoCyprusCzech RepublicDenmarkDominican RepublicEarly-demographic dividendEast Asia & PacificEast Asia & Pacific (excluding high income)East Asia & Pacific (IDA & IBRD countries)EcuadorEgypt, Arab Rep.El SalvadorEritreaEstoniaEthiopiaEuro areaEurope & Central AsiaEurope & Central Asia (excluding high income)Europe & Central Asia (IDA & IBRD countries)European UnionFinlandFragile and conflict affected situationsFranceGabonGeorgiaGermanyGhanaGibraltarGreeceGuatemalaHaitiHeavily indebted poor countries (HIPC)High incomeHondurasHong Kong SAR, ChinaHungaryIBRD onlyIcelandIDA & IBRD totalIDA blendIDA onlyIDA totalIndiaIndonesiaIran, Islamic Rep.IraqIrelandIsraelItalyJamaicaJapanJordanKazakhstanKenyaKorea, Dem. People’s Rep.Korea, Rep.KosovoKuwaitKyrgyz RepublicLate-demographic dividendLatin America & Caribbean Latin America & Caribbean (excluding high income)Latin America & the Caribbean (IDA & IBRD countries)LatviaLeast developed countries: UN classificationLebanonLibyaLithuaniaLow & middle incomeLow incomeLower middle incomeLuxembourgMacedonia, FYRMalaysiaMaltaMauritiusMexicoMiddle East & North AfricaMiddle East & North Africa (excluding high income)Middle East & North Africa (IDA & IBRD countries)Middle incomeMoldovaMongoliaMontenegroMoroccoMozambiqueMyanmarNamibiaNepalNetherlandsNew ZealandNicaraguaNigerNigeriaNorth AmericaNorwayOECD membersOmanOther small statesPakistanPanamaParaguayPeruPhilippinesPolandPortugalPost-demographic dividendPre-demographic dividendQatarRomaniaRussian FederationSaudi ArabiaSenegalSerbiaSingaporeSlovak RepublicSloveniaSmall statesSouth AfricaSouth AsiaSouth Asia (IDA & IBRD)South SudanSpainSri LankaSub-Saharan Africa Sub-Saharan Africa (excluding high income)Sub-Saharan Africa (IDA & IBRD countries)SudanSwedenSwitzerlandSyrian Arab RepublicTajikistanTanzaniaThailandTogoTrinidad and TobagoTunisiaTurkeyTurkmenistanUkraineUnited Arab EmiratesUnited KingdomUnited StatesUpper middle incomeUruguayUzbekistanVenezuela, RBVietnamWorldYemen, Rep.ZambiaZimbabwe Linea del tempo:
Questa scala temporale mostra un grafico dal 1961 anno al 2014 anno. New Zealand. I dati fino ad 1960 anno non disponibili. Il numero di osservazioni attuali secondo i date: 54.
La fonte (nome):
Indicatori dello sviluppo mondiale
La fonte (organizzazione):
IEA Statistics © OECD/IEA 2014 (http://www.iea.org/stats/index.asp), subject to https://www.iea.org/t&c/termsandconditions/
Categorie:
Environment
sono stati aggiornati
23 apr 2017 anni
Indicatori delle variazioni dei valori per anni
Minima:
4.066
1 gen 2009 anni
Massimo:
22.56
1 gen 1964 anni
Alla data di osservazione
Valore
Variazione assoluta
La variazione rispetto al valore precedente
1 gen 1961 anni
20.463
+20.463
0.0%
1 gen 1962 anni
20.9
+0.436
2.13%
1 gen 1963 anni
22.388
+1.488
7.12%
1 gen 1964 anni
22.56
+0.172
0.77%
1 gen 1965 anni
21.323
-1.237
-5.48%
1 gen 1966 anni
22.392
+1.069
5.01%
1 gen 1967 anni
22.477
+0.086
0.38%
1 gen 1968 anni
20.715
-1.762
-7.84%
1 gen 1969 anni
21.247
+0.531
2.57%
1 gen 1970 anni
20.588
-0.659
-3.1%
1 gen 1971 anni
13.801
-6.788
-32.97%
1 gen 1972 anni
12.074
-1.727
-12.51%
1 gen 1973 anni
12.605
+0.531
4.4%
1 gen 1974 anni
10.599
-2.006
-15.92%
1 gen 1975 anni
10.178
-0.421
-3.97%
1 gen 1976 anni
12.781
+2.603
25.58%
1 gen 1977 anni
12.156
-0.625
-4.89%
1 gen 1978 anni
11.538
-0.618
-5.08%
1 gen 1979 anni
11.917
+0.378
3.28%
1 gen 1980 anni
12.225
+0.308
2.59%
1 gen 1981 anni
12.872
+0.647
5.29%
1 gen 1982 anni
11.754
-1.118
-8.69%
1 gen 1983 anni
10.647
-1.107
-9.42%
1 gen 1984 anni
10.244
-0.403
-3.78%
1 gen 1985 anni
8.948
-1.296
-12.65%
1 gen 1986 anni
8.095
-0.853
-9.53%
1 gen 1987 anni
8.221
+0.126
1.56%
1 gen 1988 anni
7.109
-1.112
-13.53%
1 gen 1989 anni
5.879
-1.23
-17.3%
1 gen 1990 anni
6.186
+0.307
5.21%
1 gen 1991 anni
6.624
+0.438
7.08%
1 gen 1992 anni
6.029
-0.595
-8.98%
1 gen 1993 anni
5.966
-0.063
-1.04%
1 gen 1994 anni
4.868
-1.099
-18.42%
1 gen 1995 anni
5.987
+1.119
22.99%
1 gen 1996 anni
6.143
+0.156
2.61%
1 gen 1997 anni
5.213
-0.93
-15.15%
1 gen 1998 anni
4.82
-0.393
-7.54%
1 gen 1999 anni
4.942
+0.122
2.54%
1 gen 2000 anni
4.696
-0.246
-4.98%
1 gen 2001 anni
5.005
+0.309
6.59%
1 gen 2002 anni
4.78
-0.225
-4.49%
1 gen 2003 anni
4.601
-0.179
-3.75%
1 gen 2004 anni
4.853
+0.252
5.47%
1 gen 2005 anni
5.273
+0.42
8.65%
1 gen 2006 anni
4.807
-0.466
-8.83%
1 gen 2007 anni
4.393
-0.414
-8.61%
1 gen 2008 anni
4.395
+0.002
0.04%
1 gen 2009 anni
4.066
-0.329
-7.48%
1 gen 2010 anni
4.406
+0.341
8.38%
1 gen 2011 anni
4.661
+0.255
5.78%
1 gen 2012 anni
4.653
-0.008
-0.18%
1 gen 2013 anni
4.615
-0.037
-0.8%
1 gen 2014 anni
4.491
-0.125
-2.7%
Classificazione dei paesi secondo i statistiche attuali per anni


Commenti: