29
/it/
it
AIzaSyAYiBZKx7MnpbEhh9jyipgxe19OcubqV5w
April 1, 2024
266306
Tonga
TON
true
2
1
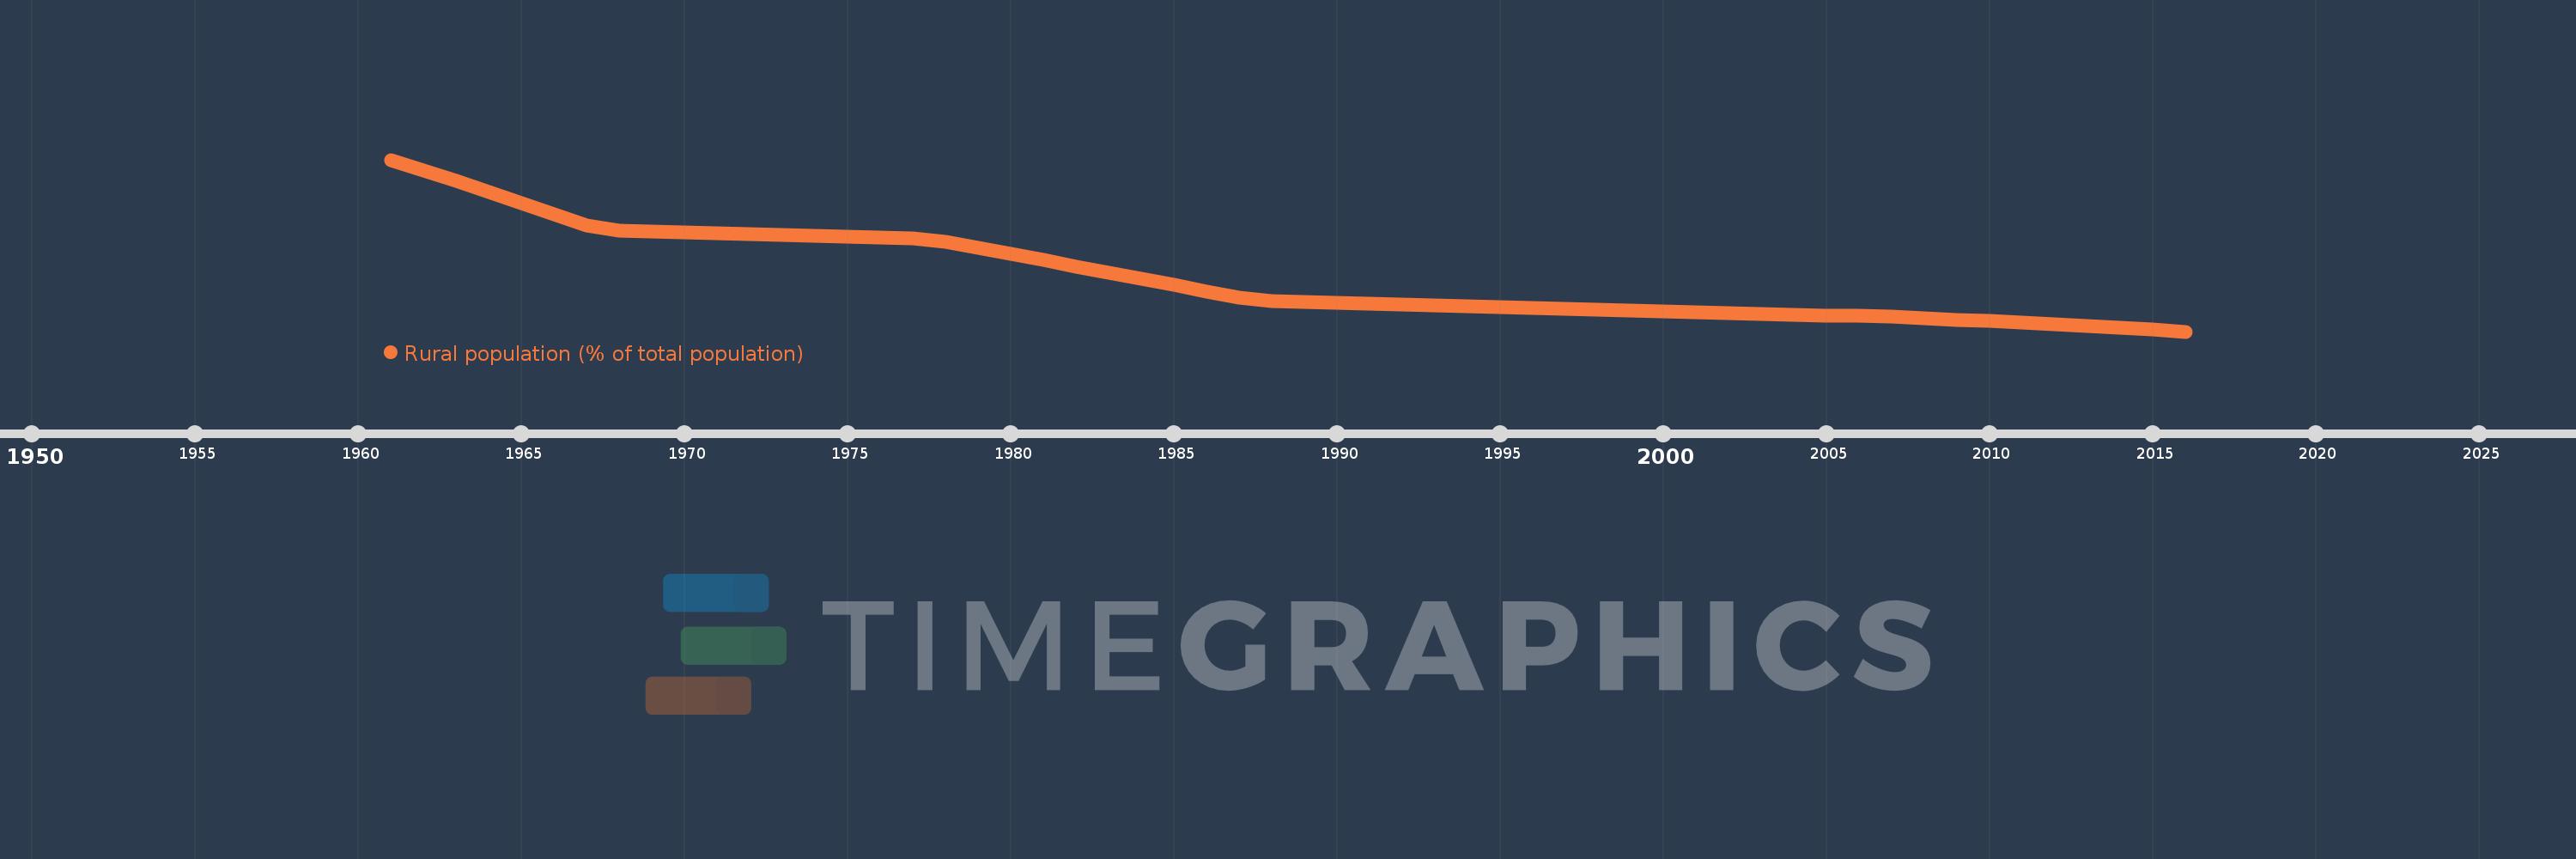
Rural population (% of total population)
2016,2015,2014,2013,2012,2011,2010,2009,2008,2007,2006,2005,2004,2003,2002,2001,2000,1999,1998,1997,1996,1995,1994,1993,1992,1991,1990,1989,1988,1987,1986,1985,1984,1983,1982,1981,1980,1979,1978,1977,1976,1975,1974,1973,1972,1971,1970,1969,1968,1967,1966,1965,1964,1963,1962,1961
Queste statistiche in altri paesi:
AfghanistanAlbaniaAlgeriaAmerican SamoaAndorraAngolaAntigua and BarbudaArab WorldArgentinaArmeniaArubaAustraliaAustriaAzerbaijanBahamas, TheBahrainBangladeshBarbadosBelarusBelgiumBelizeBeninBermudaBhutanBoliviaBosnia and HerzegovinaBotswanaBrazilBritish Virgin IslandsBrunei DarussalamBulgariaBurkina FasoBurundiCabo VerdeCambodiaCameroonCanadaCaribbean small statesCayman IslandsCentral African RepublicCentral Europe and the BalticsChadChannel IslandsChileChinaColombiaComorosCongo, Dem. Rep.Congo, Rep.Costa RicaCote d'IvoireCroatiaCubaCuracaoCyprusCzech RepublicDenmarkDjiboutiDominicaDominican RepublicEarly-demographic dividendEast Asia & PacificEast Asia & Pacific (excluding high income)East Asia & Pacific (IDA & IBRD countries)EcuadorEgypt, Arab Rep.El SalvadorEquatorial GuineaEritreaEstoniaEthiopiaEuro areaEurope & Central AsiaEurope & Central Asia (excluding high income)Europe & Central Asia (IDA & IBRD countries)European UnionFaroe IslandsFijiFinlandFragile and conflict affected situationsFranceFrench PolynesiaGabonGambia, TheGeorgiaGermanyGhanaGibraltarGreeceGreenlandGrenadaGuamGuatemalaGuineaGuinea-BissauGuyanaHaitiHeavily indebted poor countries (HIPC)High incomeHondurasHong Kong SAR, ChinaHungaryIBRD onlyIcelandIDA & IBRD totalIDA blendIDA onlyIDA totalIndiaIndonesiaIran, Islamic Rep.IraqIrelandIsle of ManIsraelItalyJamaicaJapanJordanKazakhstanKenyaKiribatiKorea, Dem. People’s Rep.Korea, Rep.KuwaitKyrgyz RepublicLao PDRLate-demographic dividendLatin America & Caribbean Latin America & Caribbean (excluding high income)Latin America & the Caribbean (IDA & IBRD countries)LatviaLeast developed countries: UN classificationLebanonLesothoLiberiaLibyaLiechtensteinLithuaniaLow & middle incomeLow incomeLower middle incomeLuxembourgMacao SAR, ChinaMacedonia, FYRMadagascarMalawiMalaysiaMaldivesMaliMaltaMarshall IslandsMauritaniaMauritiusMexicoMicronesia, Fed. Sts.Middle East & North AfricaMiddle East & North Africa (excluding high income)Middle East & North Africa (IDA & IBRD countries)Middle incomeMoldovaMonacoMongoliaMontenegroMoroccoMozambiqueMyanmarNamibiaNauruNepalNetherlandsNew CaledoniaNew ZealandNicaraguaNigerNigeriaNorth AmericaNorthern Mariana IslandsNorwayOECD membersOmanOther small statesPacific island small statesPakistanPalauPanamaPapua New GuineaParaguayPeruPhilippinesPolandPortugalPost-demographic dividendPre-demographic dividendPuerto RicoQatarRomaniaRussian FederationRwandaSamoaSan MarinoSao Tome and PrincipeSaudi ArabiaSenegalSerbiaSeychellesSierra LeoneSingaporeSint Maarten (Dutch part)Slovak RepublicSloveniaSmall statesSolomon IslandsSomaliaSouth AfricaSouth AsiaSouth Asia (IDA & IBRD)South SudanSpainSri LankaSt. Kitts and NevisSt. LuciaSt. Vincent and the GrenadinesSub-Saharan Africa Sub-Saharan Africa (excluding high income)Sub-Saharan Africa (IDA & IBRD countries)SudanSurinameSwazilandSwedenSwitzerlandSyrian Arab RepublicTajikistanTanzaniaThailandTimor-LesteTogoTongaTrinidad and TobagoTunisiaTurkeyTurkmenistanTurks and Caicos IslandsTuvaluUgandaUkraineUnited Arab EmiratesUnited KingdomUnited StatesUpper middle incomeUruguayUzbekistanVanuatuVenezuela, RBVietnamVirgin Islands (U.S.)West Bank and GazaWorldYemen, Rep.ZambiaZimbabwe Linea del tempo:
Questa scala temporale mostra un grafico dal 1961 anno al 2016 anno. Tonga. I dati fino ad 1960 anno non disponibili. Il numero di osservazioni attuali secondo i date: 56.
La fonte (nome):
Indicatori dello sviluppo mondiale
La fonte (organizzazione):
World Bank Staff estimates based on United Nations, World Urbanization Prospects.
Categorie:
Agriculture & Rural Development
sono stati aggiornati
23 apr 2017 anni
Indicatori delle variazioni dei valori per anni
Minima:
76.288
1 gen 2016 anni
Massimo:
82.448
1 gen 1961 anni
Alla data di osservazione
Valore
Variazione assoluta
La variazione rispetto al valore precedente
1 gen 1961 anni
82.448
+82.448
0.0%
1 gen 1962 anni
82.071
-0.377
-0.46%
1 gen 1963 anni
81.688
-0.383
-0.47%
1 gen 1964 anni
81.299
-0.389
-0.48%
1 gen 1965 anni
80.902
-0.397
-0.49%
1 gen 1966 anni
80.501
-0.401
-0.5%
1 gen 1967 anni
80.092
-0.409
-0.51%
1 gen 1968 anni
79.903
-0.189
-0.24%
1 gen 1969 anni
79.873
-0.03
-0.04%
1 gen 1970 anni
79.843
-0.03
-0.04%
1 gen 1971 anni
79.813
-0.03
-0.04%
1 gen 1972 anni
79.783
-0.03
-0.04%
1 gen 1973 anni
79.753
-0.03
-0.04%
1 gen 1974 anni
79.723
-0.03
-0.04%
1 gen 1975 anni
79.693
-0.03
-0.04%
1 gen 1976 anni
79.663
-0.03
-0.04%
1 gen 1977 anni
79.633
-0.03
-0.04%
1 gen 1978 anni
79.496
-0.137
-0.17%
1 gen 1979 anni
79.281
-0.215
-0.27%
1 gen 1980 anni
79.065
-0.216
-0.27%
1 gen 1981 anni
78.846
-0.219
-0.28%
1 gen 1982 anni
78.627
-0.219
-0.28%
1 gen 1983 anni
78.406
-0.221
-0.28%
1 gen 1984 anni
78.183
-0.223
-0.28%
1 gen 1985 anni
77.958
-0.225
-0.29%
1 gen 1986 anni
77.732
-0.226
-0.29%
1 gen 1987 anni
77.504
-0.228
-0.29%
1 gen 1988 anni
77.391
-0.113
-0.15%
1 gen 1989 anni
77.359
-0.032
-0.04%
1 gen 1990 anni
77.328
-0.031
-0.04%
1 gen 1991 anni
77.296
-0.032
-0.04%
1 gen 1992 anni
77.264
-0.032
-0.04%
1 gen 1993 anni
77.232
-0.032
-0.04%
1 gen 1994 anni
77.2
-0.032
-0.04%
1 gen 1995 anni
77.168
-0.032
-0.04%
1 gen 1996 anni
77.136
-0.032
-0.04%
1 gen 1997 anni
77.103
-0.033
-0.04%
1 gen 1998 anni
77.073
-0.03
-0.04%
1 gen 1999 anni
77.045
-0.028
-0.04%
1 gen 2000 anni
77.016
-0.029
-0.04%
1 gen 2001 anni
76.988
-0.028
-0.04%
1 gen 2002 anni
76.959
-0.029
-0.04%
1 gen 2003 anni
76.931
-0.028
-0.04%
1 gen 2004 anni
76.902
-0.029
-0.04%
1 gen 2005 anni
76.873
-0.029
-0.04%
1 gen 2006 anni
76.845
-0.028
-0.04%
1 gen 2007 anni
76.816
-0.029
-0.04%
1 gen 2008 anni
76.773
-0.043
-0.06%
1 gen 2009 anni
76.719
-0.054
-0.07%
1 gen 2010 anni
76.665
-0.054
-0.07%
1 gen 2011 anni
76.611
-0.054
-0.07%
1 gen 2012 anni
76.557
-0.054
-0.07%
1 gen 2013 anni
76.502
-0.055
-0.07%
1 gen 2014 anni
76.44
-0.062
-0.08%
1 gen 2015 anni
76.368
-0.072
-0.09%
1 gen 2016 anni
76.288
-0.08
-0.1%
Classificazione dei paesi secondo i statistiche attuali per anni


Commenti: