29
/it/
it
AIzaSyAYiBZKx7MnpbEhh9jyipgxe19OcubqV5w
April 1, 2024
160967
Israel
ISR
true
2
1
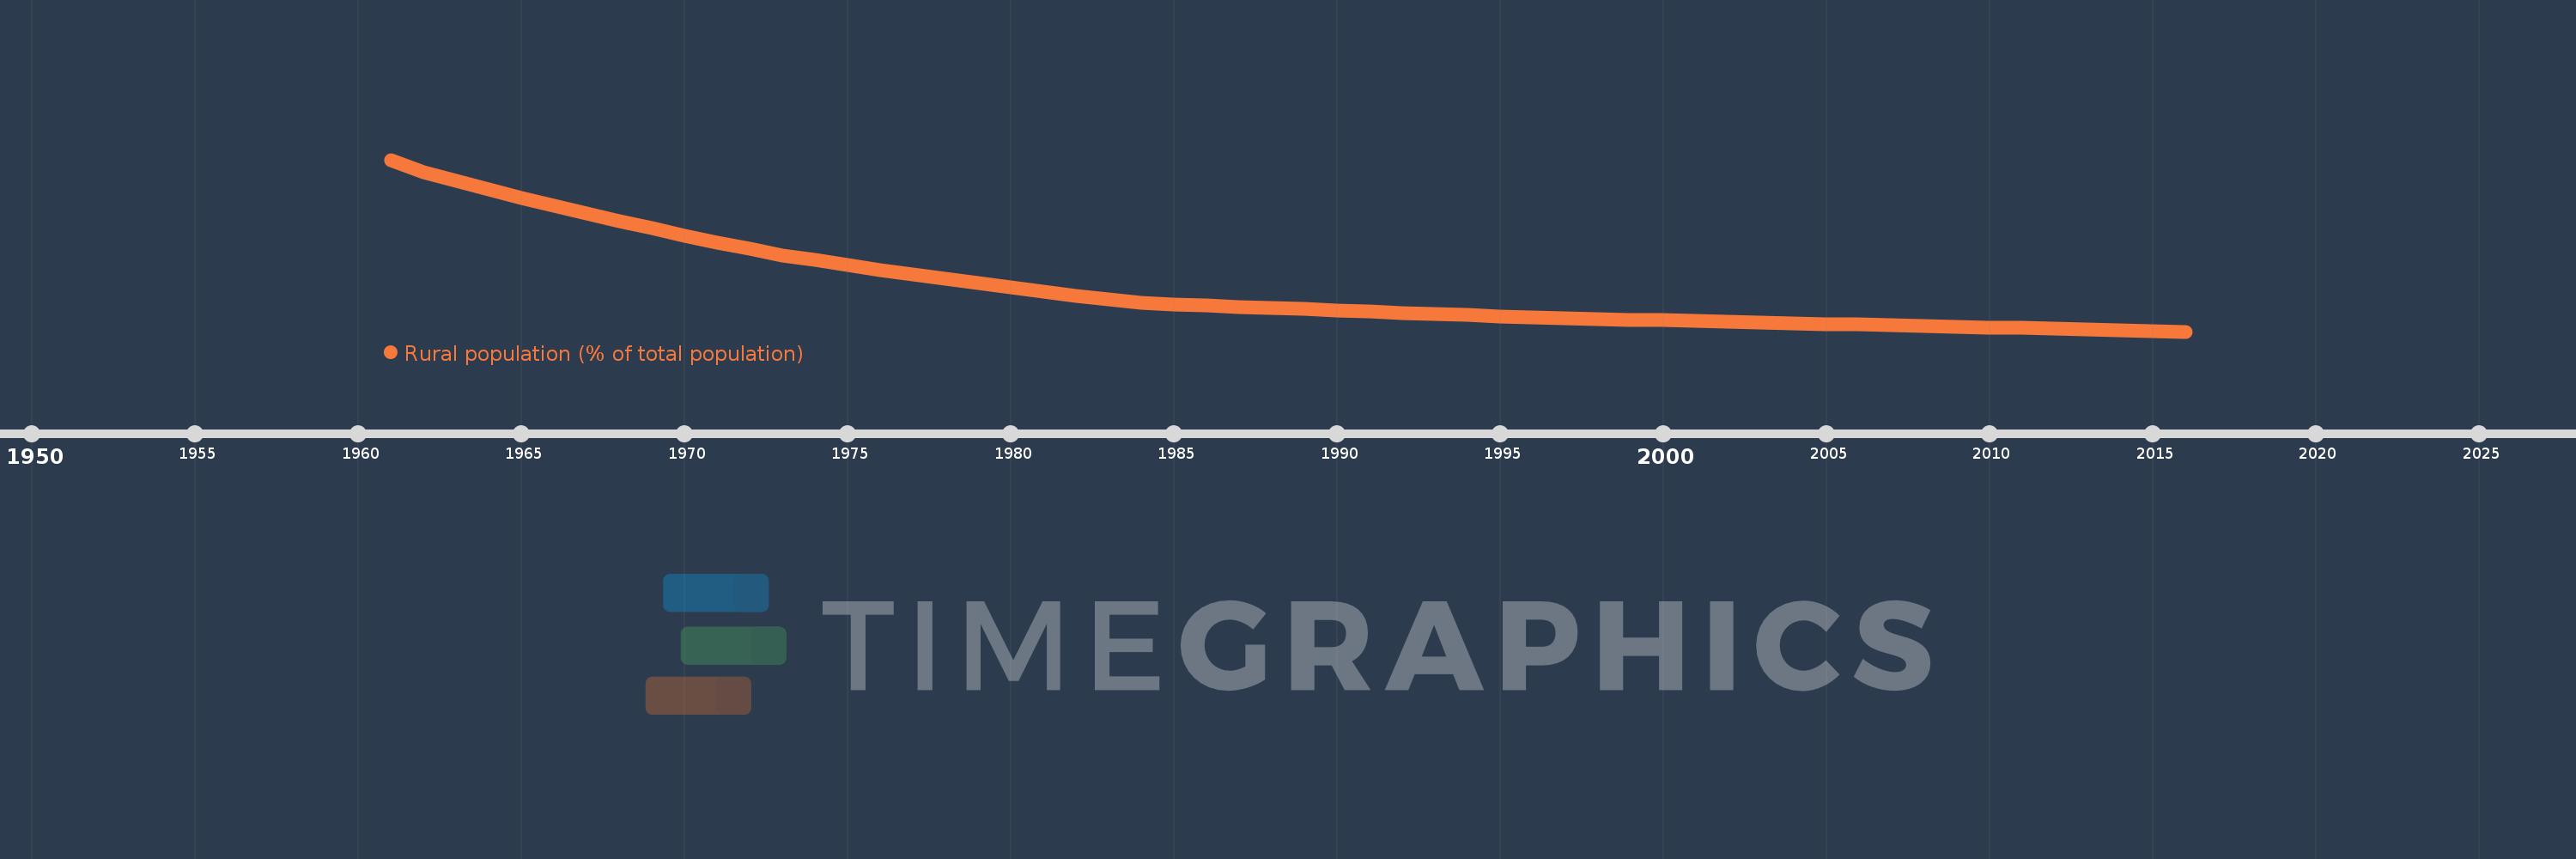
Rural population (% of total population)
2016,2015,2014,2013,2012,2011,2010,2009,2008,2007,2006,2005,2004,2003,2002,2001,2000,1999,1998,1997,1996,1995,1994,1993,1992,1991,1990,1989,1988,1987,1986,1985,1984,1983,1982,1981,1980,1979,1978,1977,1976,1975,1974,1973,1972,1971,1970,1969,1968,1967,1966,1965,1964,1963,1962,1961
Queste statistiche in altri paesi:
AfghanistanAlbaniaAlgeriaAmerican SamoaAndorraAngolaAntigua and BarbudaArab WorldArgentinaArmeniaArubaAustraliaAustriaAzerbaijanBahamas, TheBahrainBangladeshBarbadosBelarusBelgiumBelizeBeninBermudaBhutanBoliviaBosnia and HerzegovinaBotswanaBrazilBritish Virgin IslandsBrunei DarussalamBulgariaBurkina FasoBurundiCabo VerdeCambodiaCameroonCanadaCaribbean small statesCayman IslandsCentral African RepublicCentral Europe and the BalticsChadChannel IslandsChileChinaColombiaComorosCongo, Dem. Rep.Congo, Rep.Costa RicaCote d'IvoireCroatiaCubaCuracaoCyprusCzech RepublicDenmarkDjiboutiDominicaDominican RepublicEarly-demographic dividendEast Asia & PacificEast Asia & Pacific (excluding high income)East Asia & Pacific (IDA & IBRD countries)EcuadorEgypt, Arab Rep.El SalvadorEquatorial GuineaEritreaEstoniaEthiopiaEuro areaEurope & Central AsiaEurope & Central Asia (excluding high income)Europe & Central Asia (IDA & IBRD countries)European UnionFaroe IslandsFijiFinlandFragile and conflict affected situationsFranceFrench PolynesiaGabonGambia, TheGeorgiaGermanyGhanaGibraltarGreeceGreenlandGrenadaGuamGuatemalaGuineaGuinea-BissauGuyanaHaitiHeavily indebted poor countries (HIPC)High incomeHondurasHong Kong SAR, ChinaHungaryIBRD onlyIcelandIDA & IBRD totalIDA blendIDA onlyIDA totalIndiaIndonesiaIran, Islamic Rep.IraqIrelandIsle of ManIsraelItalyJamaicaJapanJordanKazakhstanKenyaKiribatiKorea, Dem. People’s Rep.Korea, Rep.KuwaitKyrgyz RepublicLao PDRLate-demographic dividendLatin America & Caribbean Latin America & Caribbean (excluding high income)Latin America & the Caribbean (IDA & IBRD countries)LatviaLeast developed countries: UN classificationLebanonLesothoLiberiaLibyaLiechtensteinLithuaniaLow & middle incomeLow incomeLower middle incomeLuxembourgMacao SAR, ChinaMacedonia, FYRMadagascarMalawiMalaysiaMaldivesMaliMaltaMarshall IslandsMauritaniaMauritiusMexicoMicronesia, Fed. Sts.Middle East & North AfricaMiddle East & North Africa (excluding high income)Middle East & North Africa (IDA & IBRD countries)Middle incomeMoldovaMonacoMongoliaMontenegroMoroccoMozambiqueMyanmarNamibiaNauruNepalNetherlandsNew CaledoniaNew ZealandNicaraguaNigerNigeriaNorth AmericaNorthern Mariana IslandsNorwayOECD membersOmanOther small statesPacific island small statesPakistanPalauPanamaPapua New GuineaParaguayPeruPhilippinesPolandPortugalPost-demographic dividendPre-demographic dividendPuerto RicoQatarRomaniaRussian FederationRwandaSamoaSan MarinoSao Tome and PrincipeSaudi ArabiaSenegalSerbiaSeychellesSierra LeoneSingaporeSint Maarten (Dutch part)Slovak RepublicSloveniaSmall statesSolomon IslandsSomaliaSouth AfricaSouth AsiaSouth Asia (IDA & IBRD)South SudanSpainSri LankaSt. Kitts and NevisSt. LuciaSt. Vincent and the GrenadinesSub-Saharan Africa Sub-Saharan Africa (excluding high income)Sub-Saharan Africa (IDA & IBRD countries)SudanSurinameSwazilandSwedenSwitzerlandSyrian Arab RepublicTajikistanTanzaniaThailandTimor-LesteTogoTongaTrinidad and TobagoTunisiaTurkeyTurkmenistanTurks and Caicos IslandsTuvaluUgandaUkraineUnited Arab EmiratesUnited KingdomUnited StatesUpper middle incomeUruguayUzbekistanVanuatuVenezuela, RBVietnamVirgin Islands (U.S.)West Bank and GazaWorldYemen, Rep.ZambiaZimbabwe Linea del tempo:
Questa scala temporale mostra un grafico dal 1961 anno al 2016 anno. Israel. I dati fino ad 1960 anno non disponibili. Il numero di osservazioni attuali secondo i date: 56.
La fonte (nome):
Indicatori dello sviluppo mondiale
La fonte (organizzazione):
World Bank Staff estimates based on United Nations, World Urbanization Prospects.
Categorie:
Agriculture & Rural Development
sono stati aggiornati
23 apr 2017 anni
Indicatori delle variazioni dei valori per anni
Minima:
7.86
1 gen 2016 anni
Massimo:
23.152
1 gen 1961 anni
Alla data di osservazione
Valore
Variazione assoluta
La variazione rispetto al valore precedente
1 gen 1961 anni
23.152
+23.152
0.0%
1 gen 1962 anni
22.015
-1.137
-4.91%
1 gen 1963 anni
21.246
-0.769
-3.49%
1 gen 1964 anni
20.498
-0.748
-3.52%
1 gen 1965 anni
19.768
-0.73
-3.56%
1 gen 1966 anni
19.06
-0.708
-3.58%
1 gen 1967 anni
18.37
-0.69
-3.62%
1 gen 1968 anni
17.7
-0.67
-3.65%
1 gen 1969 anni
17.048
-0.652
-3.68%
1 gen 1970 anni
16.418
-0.63
-3.7%
1 gen 1971 anni
15.805
-0.613
-3.73%
1 gen 1972 anni
15.211
-0.594
-3.76%
1 gen 1973 anni
14.649
-0.562
-3.69%
1 gen 1974 anni
14.207
-0.442
-3.02%
1 gen 1975 anni
13.776
-0.431
-3.03%
1 gen 1976 anni
13.357
-0.419
-3.04%
1 gen 1977 anni
12.947
-0.41
-3.07%
1 gen 1978 anni
12.55
-0.397
-3.07%
1 gen 1979 anni
12.162
-0.388
-3.09%
1 gen 1980 anni
11.785
-0.377
-3.1%
1 gen 1981 anni
11.417
-0.368
-3.12%
1 gen 1982 anni
11.06
-0.357
-3.13%
1 gen 1983 anni
10.713
-0.347
-3.14%
1 gen 1984 anni
10.392
-0.321
-3.0%
1 gen 1985 anni
10.281
-0.111
-1.07%
1 gen 1986 anni
10.172
-0.109
-1.06%
1 gen 1987 anni
10.064
-0.108
-1.06%
1 gen 1988 anni
9.956
-0.108
-1.07%
1 gen 1989 anni
9.85
-0.106
-1.06%
1 gen 1990 anni
9.745
-0.105
-1.07%
1 gen 1991 anni
9.641
-0.104
-1.07%
1 gen 1992 anni
9.537
-0.104
-1.08%
1 gen 1993 anni
9.435
-0.102
-1.07%
1 gen 1994 anni
9.334
-0.101
-1.07%
1 gen 1995 anni
9.233
-0.101
-1.08%
1 gen 1996 anni
9.134
-0.099
-1.07%
1 gen 1997 anni
9.057
-0.077
-0.84%
1 gen 1998 anni
8.991
-0.066
-0.73%
1 gen 1999 anni
8.926
-0.065
-0.72%
1 gen 2000 anni
8.861
-0.065
-0.73%
1 gen 2001 anni
8.797
-0.064
-0.72%
1 gen 2002 anni
8.733
-0.064
-0.73%
1 gen 2003 anni
8.67
-0.063
-0.72%
1 gen 2004 anni
8.607
-0.063
-0.73%
1 gen 2005 anni
8.544
-0.063
-0.73%
1 gen 2006 anni
8.482
-0.062
-0.73%
1 gen 2007 anni
8.42
-0.062
-0.73%
1 gen 2008 anni
8.359
-0.061
-0.72%
1 gen 2009 anni
8.298
-0.061
-0.73%
1 gen 2010 anni
8.237
-0.061
-0.74%
1 gen 2011 anni
8.176
-0.061
-0.74%
1 gen 2012 anni
8.114
-0.062
-0.76%
1 gen 2013 anni
8.051
-0.063
-0.78%
1 gen 2014 anni
7.988
-0.063
-0.78%
1 gen 2015 anni
7.924
-0.064
-0.8%
1 gen 2016 anni
7.86
-0.064
-0.81%
Classificazione dei paesi secondo i statistiche attuali per anni


Commenti: