29
/it/
it
AIzaSyAYiBZKx7MnpbEhh9jyipgxe19OcubqV5w
April 1, 2024
181591
Lithuania
LTU
true
2
1
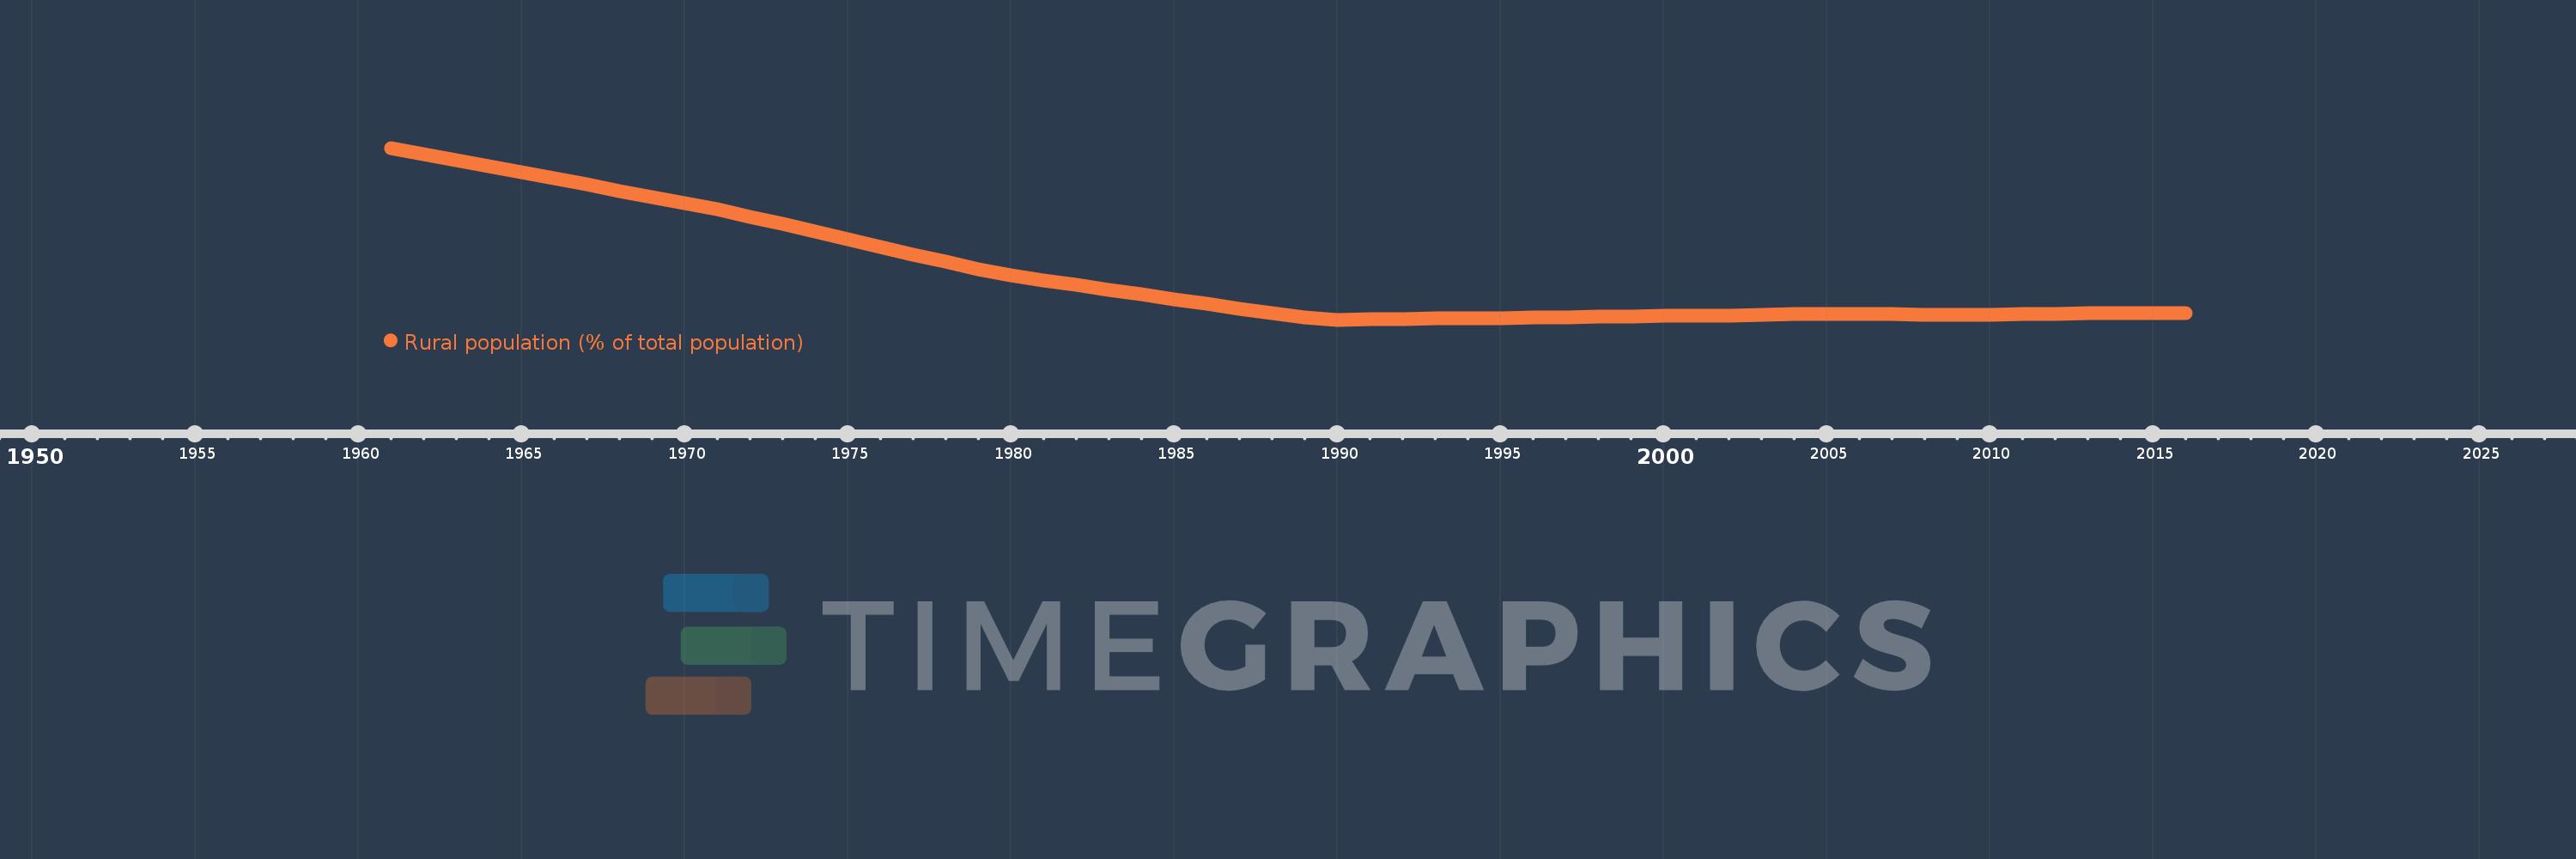
Rural population (% of total population)
2016,2015,2014,2013,2012,2011,2010,2009,2008,2007,2006,2005,2004,2003,2002,2001,2000,1999,1998,1997,1996,1995,1994,1993,1992,1991,1990,1989,1988,1987,1986,1985,1984,1983,1982,1981,1980,1979,1978,1977,1976,1975,1974,1973,1972,1971,1970,1969,1968,1967,1966,1965,1964,1963,1962,1961
Queste statistiche in altri paesi:
AfghanistanAlbaniaAlgeriaAmerican SamoaAndorraAngolaAntigua and BarbudaArab WorldArgentinaArmeniaArubaAustraliaAustriaAzerbaijanBahamas, TheBahrainBangladeshBarbadosBelarusBelgiumBelizeBeninBermudaBhutanBoliviaBosnia and HerzegovinaBotswanaBrazilBritish Virgin IslandsBrunei DarussalamBulgariaBurkina FasoBurundiCabo VerdeCambodiaCameroonCanadaCaribbean small statesCayman IslandsCentral African RepublicCentral Europe and the BalticsChadChannel IslandsChileChinaColombiaComorosCongo, Dem. Rep.Congo, Rep.Costa RicaCote d'IvoireCroatiaCubaCuracaoCyprusCzech RepublicDenmarkDjiboutiDominicaDominican RepublicEarly-demographic dividendEast Asia & PacificEast Asia & Pacific (excluding high income)East Asia & Pacific (IDA & IBRD countries)EcuadorEgypt, Arab Rep.El SalvadorEquatorial GuineaEritreaEstoniaEthiopiaEuro areaEurope & Central AsiaEurope & Central Asia (excluding high income)Europe & Central Asia (IDA & IBRD countries)European UnionFaroe IslandsFijiFinlandFragile and conflict affected situationsFranceFrench PolynesiaGabonGambia, TheGeorgiaGermanyGhanaGibraltarGreeceGreenlandGrenadaGuamGuatemalaGuineaGuinea-BissauGuyanaHaitiHeavily indebted poor countries (HIPC)High incomeHondurasHong Kong SAR, ChinaHungaryIBRD onlyIcelandIDA & IBRD totalIDA blendIDA onlyIDA totalIndiaIndonesiaIran, Islamic Rep.IraqIrelandIsle of ManIsraelItalyJamaicaJapanJordanKazakhstanKenyaKiribatiKorea, Dem. People’s Rep.Korea, Rep.KuwaitKyrgyz RepublicLao PDRLate-demographic dividendLatin America & Caribbean Latin America & Caribbean (excluding high income)Latin America & the Caribbean (IDA & IBRD countries)LatviaLeast developed countries: UN classificationLebanonLesothoLiberiaLibyaLiechtensteinLithuaniaLow & middle incomeLow incomeLower middle incomeLuxembourgMacao SAR, ChinaMacedonia, FYRMadagascarMalawiMalaysiaMaldivesMaliMaltaMarshall IslandsMauritaniaMauritiusMexicoMicronesia, Fed. Sts.Middle East & North AfricaMiddle East & North Africa (excluding high income)Middle East & North Africa (IDA & IBRD countries)Middle incomeMoldovaMonacoMongoliaMontenegroMoroccoMozambiqueMyanmarNamibiaNauruNepalNetherlandsNew CaledoniaNew ZealandNicaraguaNigerNigeriaNorth AmericaNorthern Mariana IslandsNorwayOECD membersOmanOther small statesPacific island small statesPakistanPalauPanamaPapua New GuineaParaguayPeruPhilippinesPolandPortugalPost-demographic dividendPre-demographic dividendPuerto RicoQatarRomaniaRussian FederationRwandaSamoaSan MarinoSao Tome and PrincipeSaudi ArabiaSenegalSerbiaSeychellesSierra LeoneSingaporeSint Maarten (Dutch part)Slovak RepublicSloveniaSmall statesSolomon IslandsSomaliaSouth AfricaSouth AsiaSouth Asia (IDA & IBRD)South SudanSpainSri LankaSt. Kitts and NevisSt. LuciaSt. Vincent and the GrenadinesSub-Saharan Africa Sub-Saharan Africa (excluding high income)Sub-Saharan Africa (IDA & IBRD countries)SudanSurinameSwazilandSwedenSwitzerlandSyrian Arab RepublicTajikistanTanzaniaThailandTimor-LesteTogoTongaTrinidad and TobagoTunisiaTurkeyTurkmenistanTurks and Caicos IslandsTuvaluUgandaUkraineUnited Arab EmiratesUnited KingdomUnited StatesUpper middle incomeUruguayUzbekistanVanuatuVenezuela, RBVietnamVirgin Islands (U.S.)West Bank and GazaWorldYemen, Rep.ZambiaZimbabwe Linea del tempo:
Questa scala temporale mostra un grafico dal 1961 anno al 2016 anno. Lithuania. I dati fino ad 1960 anno non disponibili. Il numero di osservazioni attuali secondo i date: 56.
La fonte (nome):
Indicatori dello sviluppo mondiale
La fonte (organizzazione):
World Bank Staff estimates based on United Nations, World Urbanization Prospects.
Categorie:
Agriculture & Rural Development
sono stati aggiornati
23 apr 2017 anni
Indicatori delle variazioni dei valori per anni
Minima:
32.358
1 gen 1990 anni
Massimo:
60.54
1 gen 1961 anni
Alla data di osservazione
Valore
Variazione assoluta
La variazione rispetto al valore precedente
1 gen 1961 anni
60.54
+60.54
0.0%
1 gen 1962 anni
59.557
-0.983
-1.62%
1 gen 1963 anni
58.565
-0.992
-1.67%
1 gen 1964 anni
57.566
-0.999
-1.71%
1 gen 1965 anni
56.559
-1.007
-1.75%
1 gen 1966 anni
55.55
-1.009
-1.78%
1 gen 1967 anni
54.535
-1.015
-1.83%
1 gen 1968 anni
53.516
-1.019
-1.87%
1 gen 1969 anni
52.493
-1.023
-1.91%
1 gen 1970 anni
51.47
-1.023
-1.95%
1 gen 1971 anni
50.445
-1.025
-1.99%
1 gen 1972 anni
49.281
-1.164
-2.31%
1 gen 1973 anni
48.032
-1.249
-2.53%
1 gen 1974 anni
46.79
-1.242
-2.59%
1 gen 1975 anni
45.549
-1.241
-2.65%
1 gen 1976 anni
44.315
-1.234
-2.71%
1 gen 1977 anni
43.085
-1.23
-2.78%
1 gen 1978 anni
41.868
-1.217
-2.82%
1 gen 1979 anni
40.658
-1.21
-2.89%
1 gen 1980 anni
39.639
-1.019
-2.51%
1 gen 1981 anni
38.842
-0.797
-2.01%
1 gen 1982 anni
38.054
-0.788
-2.03%
1 gen 1983 anni
37.27
-0.784
-2.06%
1 gen 1984 anni
36.494
-0.776
-2.08%
1 gen 1985 anni
35.723
-0.771
-2.11%
1 gen 1986 anni
34.962
-0.761
-2.13%
1 gen 1987 anni
34.207
-0.755
-2.16%
1 gen 1988 anni
33.46
-0.747
-2.18%
1 gen 1989 anni
32.72
-0.74
-2.21%
1 gen 1990 anni
32.358
-0.362
-1.11%
1 gen 1991 anni
32.417
+0.059
0.18%
1 gen 1992 anni
32.477
+0.06
0.19%
1 gen 1993 anni
32.536
+0.059
0.18%
1 gen 1994 anni
32.596
+0.06
0.18%
1 gen 1995 anni
32.655
+0.059
0.18%
1 gen 1996 anni
32.715
+0.06
0.18%
1 gen 1997 anni
32.775
+0.06
0.18%
1 gen 1998 anni
32.834
+0.059
0.18%
1 gen 1999 anni
32.894
+0.06
0.18%
1 gen 2000 anni
32.954
+0.06
0.18%
1 gen 2001 anni
33.014
+0.06
0.18%
1 gen 2002 anni
33.081
+0.067
0.2%
1 gen 2003 anni
33.172
+0.091
0.28%
1 gen 2004 anni
33.263
+0.091
0.27%
1 gen 2005 anni
33.354
+0.091
0.27%
1 gen 2006 anni
33.365
+0.011
0.03%
1 gen 2007 anni
33.294
-0.071
-0.21%
1 gen 2008 anni
33.223
-0.071
-0.21%
1 gen 2009 anni
33.152
-0.071
-0.21%
1 gen 2010 anni
33.158
+0.006
0.02%
1 gen 2011 anni
33.243
+0.085
0.26%
1 gen 2012 anni
33.328
+0.085
0.26%
1 gen 2013 anni
33.396
+0.068
0.2%
1 gen 2014 anni
33.446
+0.05
0.15%
1 gen 2015 anni
33.478
+0.032
0.1%
1 gen 2016 anni
33.492
+0.014
0.04%
Classificazione dei paesi secondo i statistiche attuali per anni


Commenti: