29
/it/
it
AIzaSyAYiBZKx7MnpbEhh9jyipgxe19OcubqV5w
April 1, 2024
142292
Greece
GRC
true
2
1
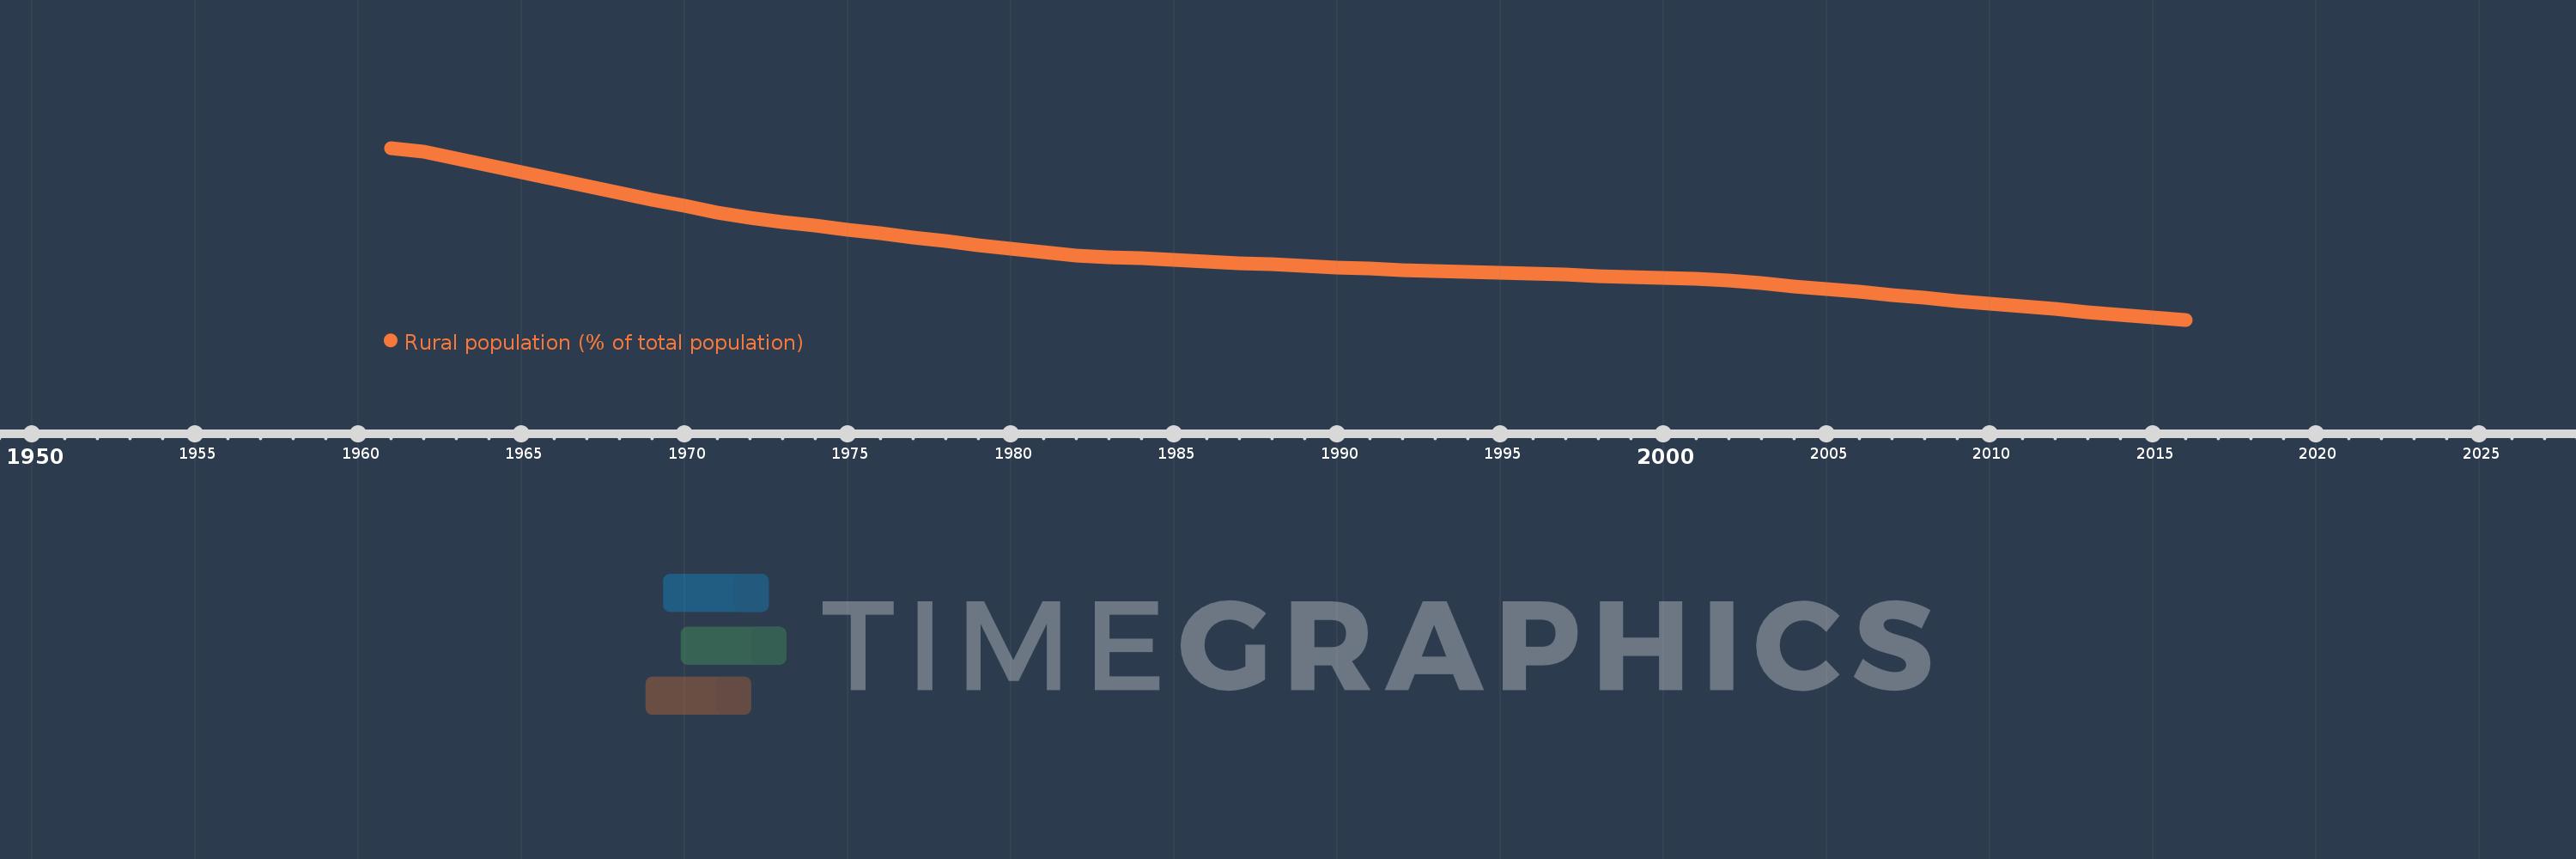
Rural population (% of total population)
2016,2015,2014,2013,2012,2011,2010,2009,2008,2007,2006,2005,2004,2003,2002,2001,2000,1999,1998,1997,1996,1995,1994,1993,1992,1991,1990,1989,1988,1987,1986,1985,1984,1983,1982,1981,1980,1979,1978,1977,1976,1975,1974,1973,1972,1971,1970,1969,1968,1967,1966,1965,1964,1963,1962,1961
Queste statistiche in altri paesi:
AfghanistanAlbaniaAlgeriaAmerican SamoaAndorraAngolaAntigua and BarbudaArab WorldArgentinaArmeniaArubaAustraliaAustriaAzerbaijanBahamas, TheBahrainBangladeshBarbadosBelarusBelgiumBelizeBeninBermudaBhutanBoliviaBosnia and HerzegovinaBotswanaBrazilBritish Virgin IslandsBrunei DarussalamBulgariaBurkina FasoBurundiCabo VerdeCambodiaCameroonCanadaCaribbean small statesCayman IslandsCentral African RepublicCentral Europe and the BalticsChadChannel IslandsChileChinaColombiaComorosCongo, Dem. Rep.Congo, Rep.Costa RicaCote d'IvoireCroatiaCubaCuracaoCyprusCzech RepublicDenmarkDjiboutiDominicaDominican RepublicEarly-demographic dividendEast Asia & PacificEast Asia & Pacific (excluding high income)East Asia & Pacific (IDA & IBRD countries)EcuadorEgypt, Arab Rep.El SalvadorEquatorial GuineaEritreaEstoniaEthiopiaEuro areaEurope & Central AsiaEurope & Central Asia (excluding high income)Europe & Central Asia (IDA & IBRD countries)European UnionFaroe IslandsFijiFinlandFragile and conflict affected situationsFranceFrench PolynesiaGabonGambia, TheGeorgiaGermanyGhanaGibraltarGreeceGreenlandGrenadaGuamGuatemalaGuineaGuinea-BissauGuyanaHaitiHeavily indebted poor countries (HIPC)High incomeHondurasHong Kong SAR, ChinaHungaryIBRD onlyIcelandIDA & IBRD totalIDA blendIDA onlyIDA totalIndiaIndonesiaIran, Islamic Rep.IraqIrelandIsle of ManIsraelItalyJamaicaJapanJordanKazakhstanKenyaKiribatiKorea, Dem. People’s Rep.Korea, Rep.KuwaitKyrgyz RepublicLao PDRLate-demographic dividendLatin America & Caribbean Latin America & Caribbean (excluding high income)Latin America & the Caribbean (IDA & IBRD countries)LatviaLeast developed countries: UN classificationLebanonLesothoLiberiaLibyaLiechtensteinLithuaniaLow & middle incomeLow incomeLower middle incomeLuxembourgMacao SAR, ChinaMacedonia, FYRMadagascarMalawiMalaysiaMaldivesMaliMaltaMarshall IslandsMauritaniaMauritiusMexicoMicronesia, Fed. Sts.Middle East & North AfricaMiddle East & North Africa (excluding high income)Middle East & North Africa (IDA & IBRD countries)Middle incomeMoldovaMonacoMongoliaMontenegroMoroccoMozambiqueMyanmarNamibiaNauruNepalNetherlandsNew CaledoniaNew ZealandNicaraguaNigerNigeriaNorth AmericaNorthern Mariana IslandsNorwayOECD membersOmanOther small statesPacific island small statesPakistanPalauPanamaPapua New GuineaParaguayPeruPhilippinesPolandPortugalPost-demographic dividendPre-demographic dividendPuerto RicoQatarRomaniaRussian FederationRwandaSamoaSan MarinoSao Tome and PrincipeSaudi ArabiaSenegalSerbiaSeychellesSierra LeoneSingaporeSint Maarten (Dutch part)Slovak RepublicSloveniaSmall statesSolomon IslandsSomaliaSouth AfricaSouth AsiaSouth Asia (IDA & IBRD)South SudanSpainSri LankaSt. Kitts and NevisSt. LuciaSt. Vincent and the GrenadinesSub-Saharan Africa Sub-Saharan Africa (excluding high income)Sub-Saharan Africa (IDA & IBRD countries)SudanSurinameSwazilandSwedenSwitzerlandSyrian Arab RepublicTajikistanTanzaniaThailandTimor-LesteTogoTongaTrinidad and TobagoTunisiaTurkeyTurkmenistanTurks and Caicos IslandsTuvaluUgandaUkraineUnited Arab EmiratesUnited KingdomUnited StatesUpper middle incomeUruguayUzbekistanVanuatuVenezuela, RBVietnamVirgin Islands (U.S.)West Bank and GazaWorldYemen, Rep.ZambiaZimbabwe Linea del tempo:
Questa scala temporale mostra un grafico dal 1961 anno al 2016 anno. Greece. I dati fino ad 1960 anno non disponibili. Il numero di osservazioni attuali secondo i date: 56.
La fonte (nome):
Indicatori dello sviluppo mondiale
La fonte (organizzazione):
World Bank Staff estimates based on United Nations, World Urbanization Prospects.
Categorie:
Agriculture & Rural Development
sono stati aggiornati
23 apr 2017 anni
Indicatori delle variazioni dei valori per anni
Minima:
21.993
1 gen 2016 anni
Massimo:
44.064
1 gen 1961 anni
Alla data di osservazione
Valore
Variazione assoluta
La variazione rispetto al valore precedente
1 gen 1961 anni
44.064
+44.064
0.0%
1 gen 1962 anni
43.547
-0.517
-1.17%
1 gen 1963 anni
42.66
-0.887
-2.04%
1 gen 1964 anni
41.778
-0.882
-2.07%
1 gen 1965 anni
40.901
-0.877
-2.1%
1 gen 1966 anni
40.031
-0.87
-2.13%
1 gen 1967 anni
39.167
-0.864
-2.16%
1 gen 1968 anni
38.309
-0.858
-2.19%
1 gen 1969 anni
37.457
-0.852
-2.22%
1 gen 1970 anni
36.615
-0.842
-2.25%
1 gen 1971 anni
35.78
-0.835
-2.28%
1 gen 1972 anni
35.049
-0.731
-2.04%
1 gen 1973 anni
34.546
-0.503
-1.44%
1 gen 1974 anni
34.048
-0.498
-1.44%
1 gen 1975 anni
33.552
-0.496
-1.46%
1 gen 1976 anni
33.06
-0.492
-1.47%
1 gen 1977 anni
32.571
-0.489
-1.48%
1 gen 1978 anni
32.088
-0.483
-1.48%
1 gen 1979 anni
31.607
-0.481
-1.5%
1 gen 1980 anni
31.13
-0.477
-1.51%
1 gen 1981 anni
30.657
-0.473
-1.52%
1 gen 1982 anni
30.254
-0.403
-1.31%
1 gen 1983 anni
30.06
-0.194
-0.64%
1 gen 1984 anni
29.866
-0.194
-0.65%
1 gen 1985 anni
29.673
-0.193
-0.65%
1 gen 1986 anni
29.482
-0.191
-0.64%
1 gen 1987 anni
29.291
-0.191
-0.65%
1 gen 1988 anni
29.1
-0.191
-0.65%
1 gen 1989 anni
28.91
-0.19
-0.65%
1 gen 1990 anni
28.721
-0.189
-0.65%
1 gen 1991 anni
28.533
-0.188
-0.65%
1 gen 1992 anni
28.365
-0.168
-0.59%
1 gen 1993 anni
28.243
-0.122
-0.43%
1 gen 1994 anni
28.122
-0.121
-0.43%
1 gen 1995 anni
28.002
-0.12
-0.43%
1 gen 1996 anni
27.881
-0.121
-0.43%
1 gen 1997 anni
27.761
-0.12
-0.43%
1 gen 1998 anni
27.642
-0.119
-0.43%
1 gen 1999 anni
27.522
-0.12
-0.43%
1 gen 2000 anni
27.403
-0.119
-0.43%
1 gen 2001 anni
27.284
-0.119
-0.43%
1 gen 2002 anni
27.087
-0.197
-0.72%
1 gen 2003 anni
26.697
-0.39
-1.44%
1 gen 2004 anni
26.311
-0.386
-1.45%
1 gen 2005 anni
25.927
-0.384
-1.46%
1 gen 2006 anni
25.548
-0.379
-1.46%
1 gen 2007 anni
25.173
-0.375
-1.47%
1 gen 2008 anni
24.801
-0.372
-1.48%
1 gen 2009 anni
24.432
-0.369
-1.49%
1 gen 2010 anni
24.068
-0.364
-1.49%
1 gen 2011 anni
23.708
-0.36
-1.5%
1 gen 2012 anni
23.351
-0.357
-1.51%
1 gen 2013 anni
23.0
-0.351
-1.5%
1 gen 2014 anni
22.657
-0.343
-1.49%
1 gen 2015 anni
22.322
-0.335
-1.48%
1 gen 2016 anni
21.993
-0.329
-1.47%
Classificazione dei paesi secondo i statistiche attuali per anni


Commenti: