29
/it/
it
AIzaSyAYiBZKx7MnpbEhh9jyipgxe19OcubqV5w
April 1, 2024
146302
Guinea
GIN
true
2
1
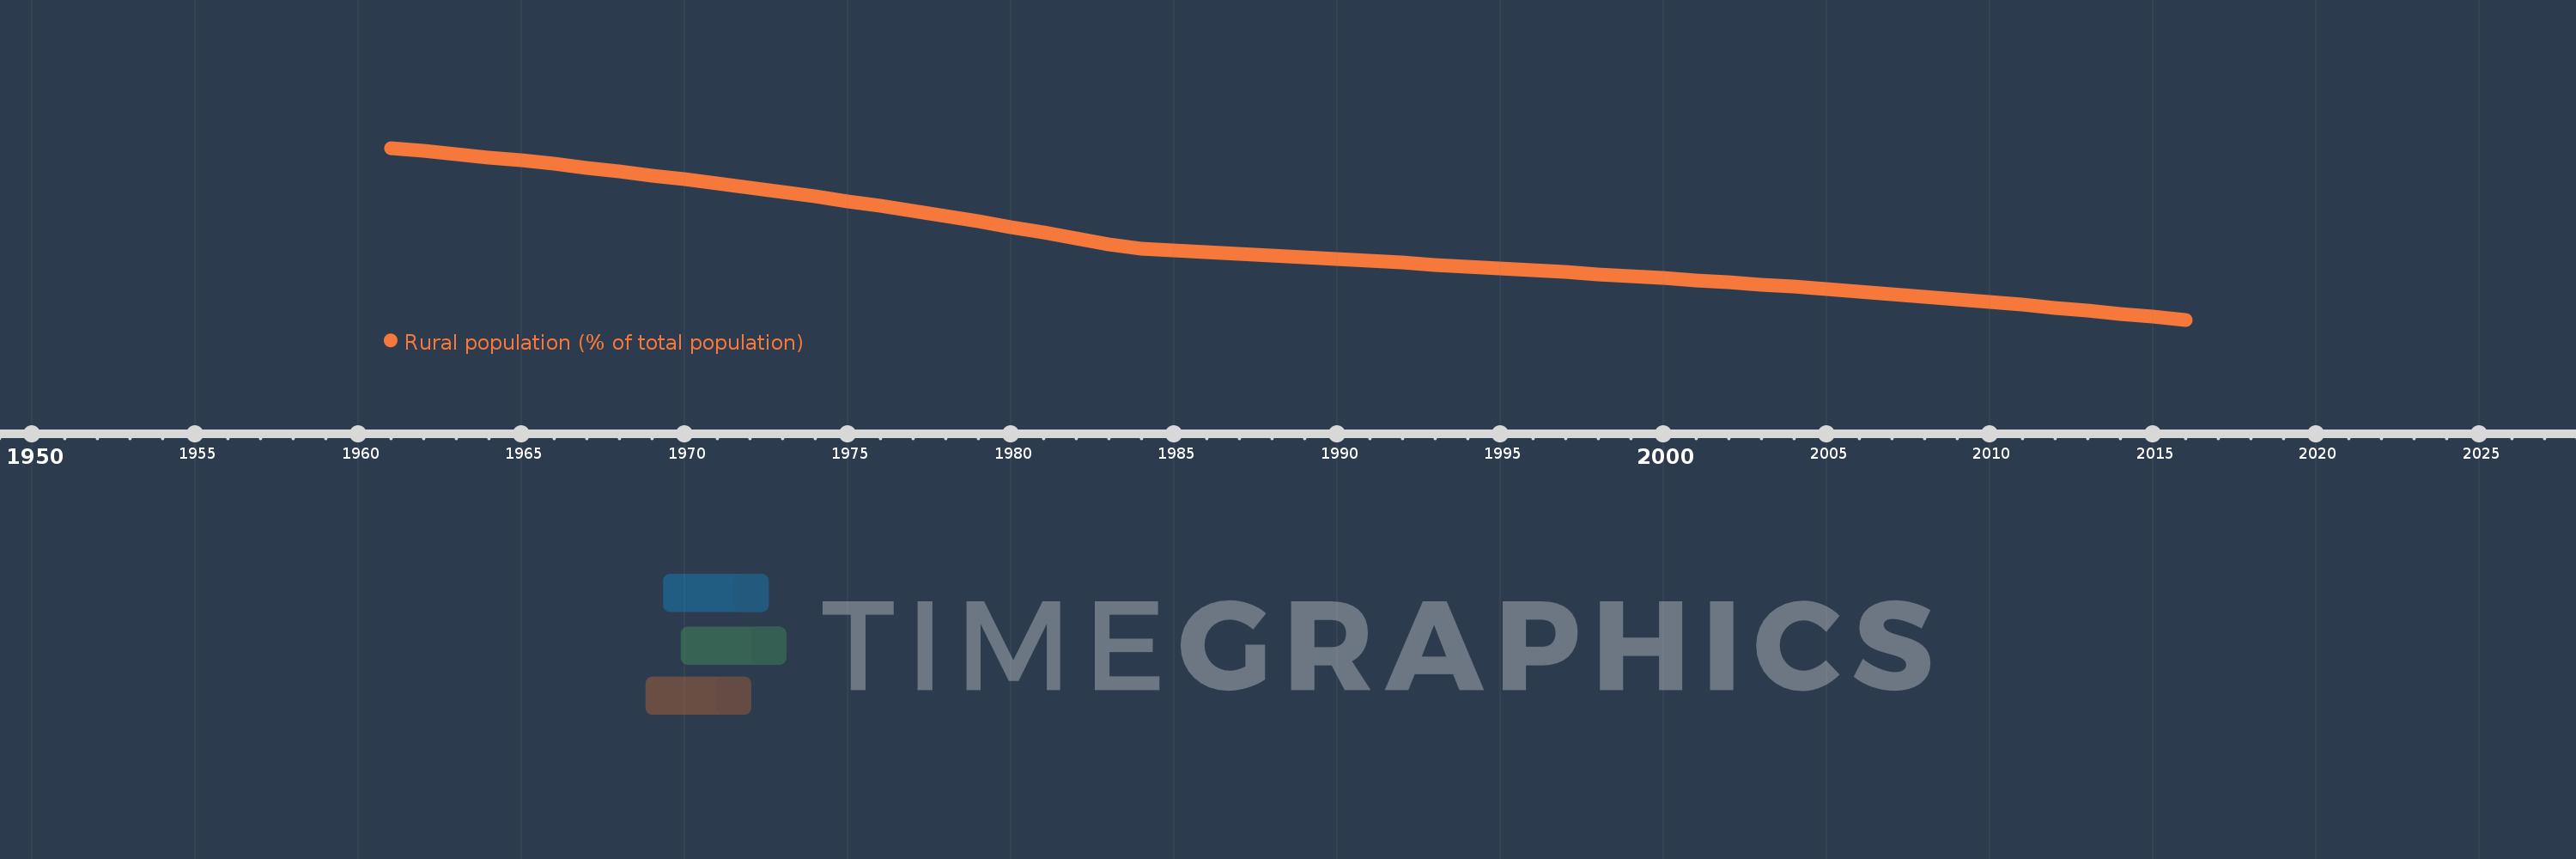
Rural population (% of total population)
2016,2015,2014,2013,2012,2011,2010,2009,2008,2007,2006,2005,2004,2003,2002,2001,2000,1999,1998,1997,1996,1995,1994,1993,1992,1991,1990,1989,1988,1987,1986,1985,1984,1983,1982,1981,1980,1979,1978,1977,1976,1975,1974,1973,1972,1971,1970,1969,1968,1967,1966,1965,1964,1963,1962,1961
Queste statistiche in altri paesi:
AfghanistanAlbaniaAlgeriaAmerican SamoaAndorraAngolaAntigua and BarbudaArab WorldArgentinaArmeniaArubaAustraliaAustriaAzerbaijanBahamas, TheBahrainBangladeshBarbadosBelarusBelgiumBelizeBeninBermudaBhutanBoliviaBosnia and HerzegovinaBotswanaBrazilBritish Virgin IslandsBrunei DarussalamBulgariaBurkina FasoBurundiCabo VerdeCambodiaCameroonCanadaCaribbean small statesCayman IslandsCentral African RepublicCentral Europe and the BalticsChadChannel IslandsChileChinaColombiaComorosCongo, Dem. Rep.Congo, Rep.Costa RicaCote d'IvoireCroatiaCubaCuracaoCyprusCzech RepublicDenmarkDjiboutiDominicaDominican RepublicEarly-demographic dividendEast Asia & PacificEast Asia & Pacific (excluding high income)East Asia & Pacific (IDA & IBRD countries)EcuadorEgypt, Arab Rep.El SalvadorEquatorial GuineaEritreaEstoniaEthiopiaEuro areaEurope & Central AsiaEurope & Central Asia (excluding high income)Europe & Central Asia (IDA & IBRD countries)European UnionFaroe IslandsFijiFinlandFragile and conflict affected situationsFranceFrench PolynesiaGabonGambia, TheGeorgiaGermanyGhanaGibraltarGreeceGreenlandGrenadaGuamGuatemalaGuineaGuinea-BissauGuyanaHaitiHeavily indebted poor countries (HIPC)High incomeHondurasHong Kong SAR, ChinaHungaryIBRD onlyIcelandIDA & IBRD totalIDA blendIDA onlyIDA totalIndiaIndonesiaIran, Islamic Rep.IraqIrelandIsle of ManIsraelItalyJamaicaJapanJordanKazakhstanKenyaKiribatiKorea, Dem. People’s Rep.Korea, Rep.KuwaitKyrgyz RepublicLao PDRLate-demographic dividendLatin America & Caribbean Latin America & Caribbean (excluding high income)Latin America & the Caribbean (IDA & IBRD countries)LatviaLeast developed countries: UN classificationLebanonLesothoLiberiaLibyaLiechtensteinLithuaniaLow & middle incomeLow incomeLower middle incomeLuxembourgMacao SAR, ChinaMacedonia, FYRMadagascarMalawiMalaysiaMaldivesMaliMaltaMarshall IslandsMauritaniaMauritiusMexicoMicronesia, Fed. Sts.Middle East & North AfricaMiddle East & North Africa (excluding high income)Middle East & North Africa (IDA & IBRD countries)Middle incomeMoldovaMonacoMongoliaMontenegroMoroccoMozambiqueMyanmarNamibiaNauruNepalNetherlandsNew CaledoniaNew ZealandNicaraguaNigerNigeriaNorth AmericaNorthern Mariana IslandsNorwayOECD membersOmanOther small statesPacific island small statesPakistanPalauPanamaPapua New GuineaParaguayPeruPhilippinesPolandPortugalPost-demographic dividendPre-demographic dividendPuerto RicoQatarRomaniaRussian FederationRwandaSamoaSan MarinoSao Tome and PrincipeSaudi ArabiaSenegalSerbiaSeychellesSierra LeoneSingaporeSint Maarten (Dutch part)Slovak RepublicSloveniaSmall statesSolomon IslandsSomaliaSouth AfricaSouth AsiaSouth Asia (IDA & IBRD)South SudanSpainSri LankaSt. Kitts and NevisSt. LuciaSt. Vincent and the GrenadinesSub-Saharan Africa Sub-Saharan Africa (excluding high income)Sub-Saharan Africa (IDA & IBRD countries)SudanSurinameSwazilandSwedenSwitzerlandSyrian Arab RepublicTajikistanTanzaniaThailandTimor-LesteTogoTongaTrinidad and TobagoTunisiaTurkeyTurkmenistanTurks and Caicos IslandsTuvaluUgandaUkraineUnited Arab EmiratesUnited KingdomUnited StatesUpper middle incomeUruguayUzbekistanVanuatuVenezuela, RBVietnamVirgin Islands (U.S.)West Bank and GazaWorldYemen, Rep.ZambiaZimbabwe Linea del tempo:
Questa scala temporale mostra un grafico dal 1961 anno al 2016 anno. Guinea. I dati fino ad 1960 anno non disponibili. Il numero di osservazioni attuali secondo i date: 56.
La fonte (nome):
Indicatori dello sviluppo mondiale
La fonte (organizzazione):
World Bank Staff estimates based on United Nations, World Urbanization Prospects.
Categorie:
Agriculture & Rural Development
sono stati aggiornati
23 apr 2017 anni
Indicatori delle variazioni dei valori per anni
Minima:
62.839
1 gen 2016 anni
Massimo:
89.528
1 gen 1961 anni
Alla data di osservazione
Valore
Variazione assoluta
La variazione rispetto al valore precedente
1 gen 1961 anni
89.528
+89.528
0.0%
1 gen 1962 anni
89.064
-0.464
-0.52%
1 gen 1963 anni
88.582
-0.482
-0.54%
1 gen 1964 anni
88.081
-0.501
-0.57%
1 gen 1965 anni
87.561
-0.52
-0.59%
1 gen 1966 anni
87.022
-0.539
-0.62%
1 gen 1967 anni
86.463
-0.559
-0.64%
1 gen 1968 anni
85.884
-0.579
-0.67%
1 gen 1969 anni
85.284
-0.6
-0.7%
1 gen 1970 anni
84.664
-0.62
-0.73%
1 gen 1971 anni
84.023
-0.641
-0.76%
1 gen 1972 anni
83.359
-0.664
-0.79%
1 gen 1973 anni
82.673
-0.686
-0.82%
1 gen 1974 anni
81.967
-0.706
-0.85%
1 gen 1975 anni
81.237
-0.73
-0.89%
1 gen 1976 anni
80.485
-0.752
-0.93%
1 gen 1977 anni
79.709
-0.776
-0.96%
1 gen 1978 anni
78.913
-0.796
-1.0%
1 gen 1979 anni
78.093
-0.82
-1.04%
1 gen 1980 anni
77.25
-0.843
-1.08%
1 gen 1981 anni
76.383
-0.867
-1.12%
1 gen 1982 anni
75.497
-0.886
-1.16%
1 gen 1983 anni
74.586
-0.911
-1.21%
1 gen 1984 anni
73.928
-0.658
-0.88%
1 gen 1985 anni
73.654
-0.274
-0.37%
1 gen 1986 anni
73.379
-0.275
-0.37%
1 gen 1987 anni
73.102
-0.277
-0.38%
1 gen 1988 anni
72.822
-0.28
-0.38%
1 gen 1989 anni
72.541
-0.281
-0.39%
1 gen 1990 anni
72.259
-0.282
-0.39%
1 gen 1991 anni
71.974
-0.285
-0.39%
1 gen 1992 anni
71.688
-0.286
-0.4%
1 gen 1993 anni
71.399
-0.289
-0.4%
1 gen 1994 anni
71.11
-0.289
-0.4%
1 gen 1995 anni
70.818
-0.292
-0.41%
1 gen 1996 anni
70.525
-0.293
-0.41%
1 gen 1997 anni
70.23
-0.295
-0.42%
1 gen 1998 anni
69.933
-0.297
-0.42%
1 gen 1999 anni
69.626
-0.307
-0.44%
1 gen 2000 anni
69.31
-0.316
-0.45%
1 gen 2001 anni
68.983
-0.327
-0.47%
1 gen 2002 anni
68.645
-0.338
-0.49%
1 gen 2003 anni
68.298
-0.347
-0.51%
1 gen 2004 anni
67.94
-0.358
-0.52%
1 gen 2005 anni
67.572
-0.368
-0.54%
1 gen 2006 anni
67.193
-0.379
-0.56%
1 gen 2007 anni
66.804
-0.389
-0.58%
1 gen 2008 anni
66.404
-0.4
-0.6%
1 gen 2009 anni
65.995
-0.409
-0.62%
1 gen 2010 anni
65.574
-0.421
-0.64%
1 gen 2011 anni
65.144
-0.43
-0.66%
1 gen 2012 anni
64.703
-0.441
-0.68%
1 gen 2013 anni
64.252
-0.451
-0.7%
1 gen 2014 anni
63.791
-0.461
-0.72%
1 gen 2015 anni
63.32
-0.471
-0.74%
1 gen 2016 anni
62.839
-0.481
-0.76%
Classificazione dei paesi secondo i statistiche attuali per anni


Commenti: