29
/it/
it
AIzaSyAYiBZKx7MnpbEhh9jyipgxe19OcubqV5w
April 1, 2024
196969
Micronesia, Fed. Sts.
FSM
true
2
1
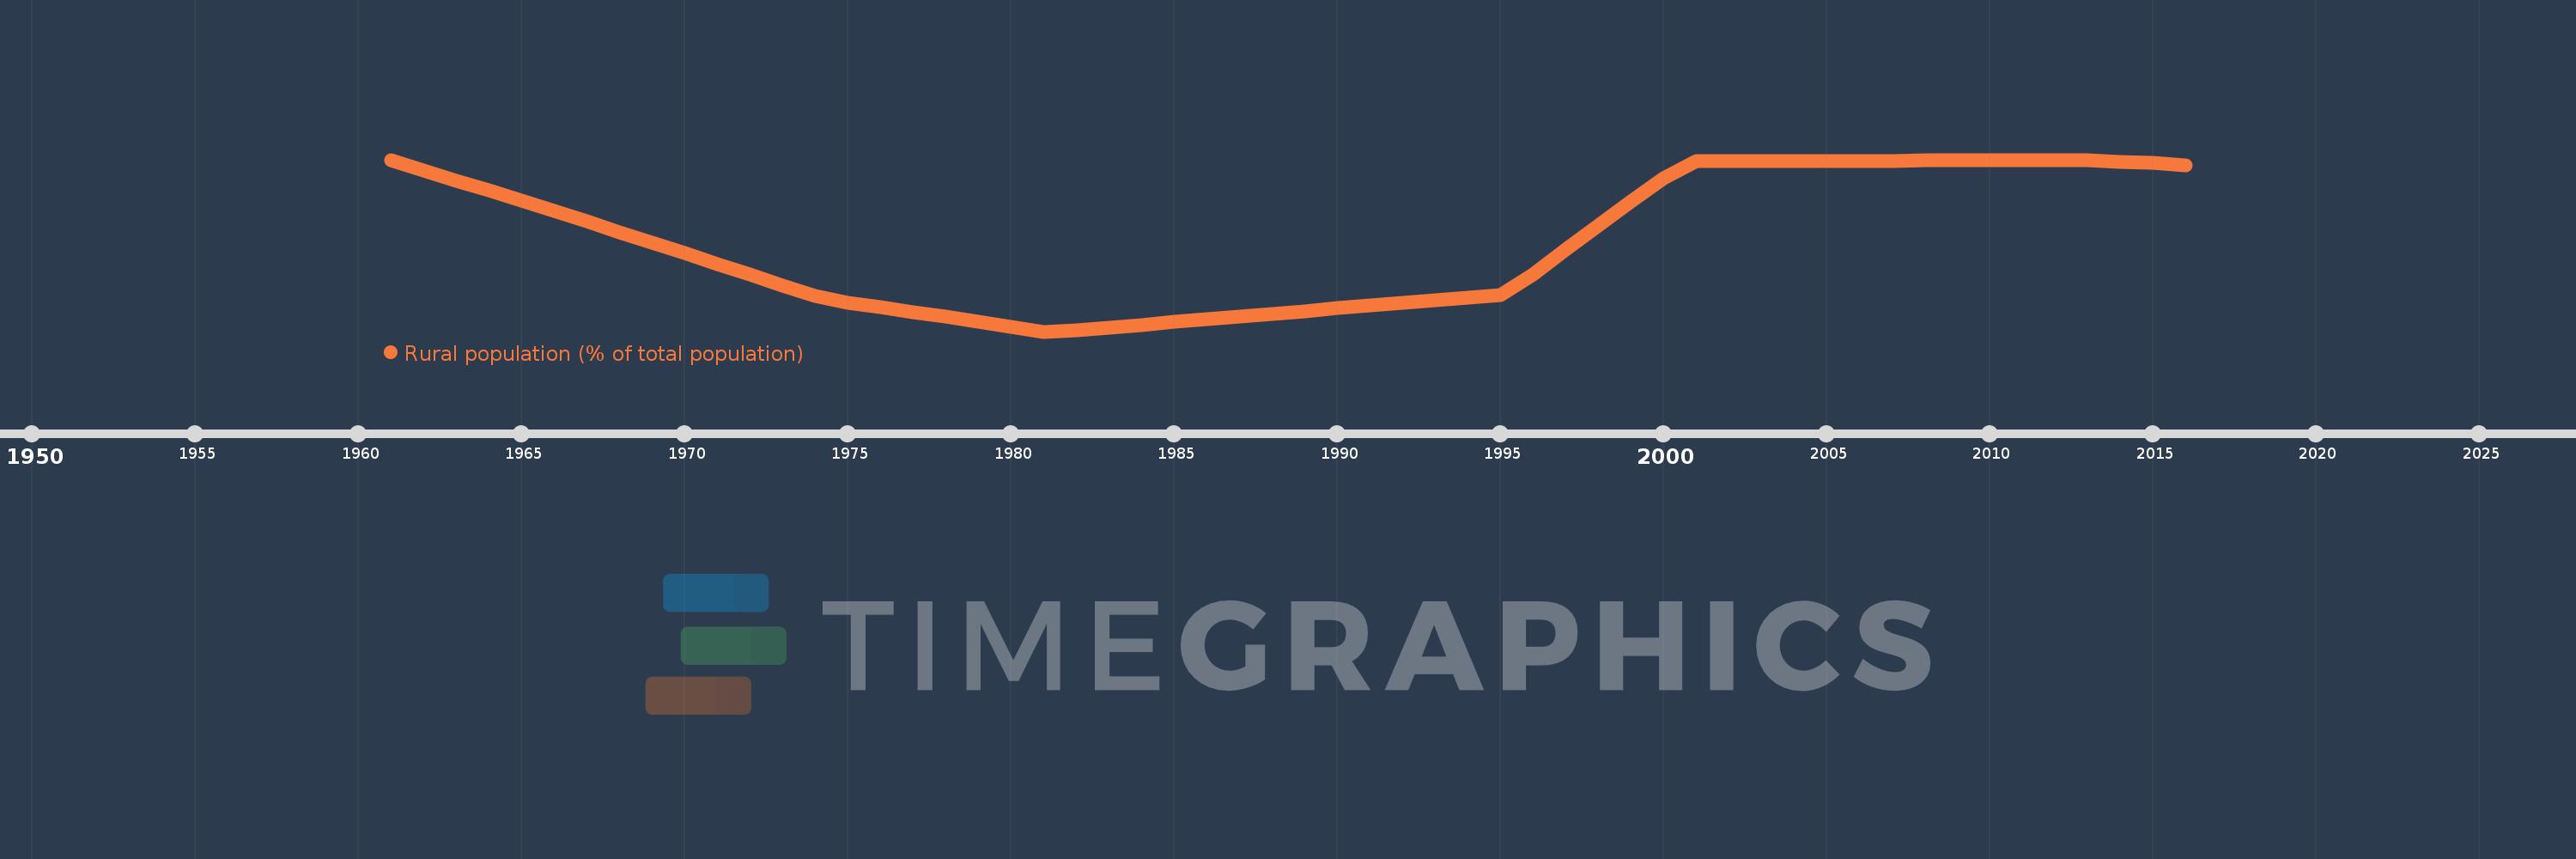
Rural population (% of total population)
2016,2015,2014,2013,2012,2011,2010,2009,2008,2007,2006,2005,2004,2003,2002,2001,2000,1999,1998,1997,1996,1995,1994,1993,1992,1991,1990,1989,1988,1987,1986,1985,1984,1983,1982,1981,1980,1979,1978,1977,1976,1975,1974,1973,1972,1971,1970,1969,1968,1967,1966,1965,1964,1963,1962,1961
Queste statistiche in altri paesi:
AfghanistanAlbaniaAlgeriaAmerican SamoaAndorraAngolaAntigua and BarbudaArab WorldArgentinaArmeniaArubaAustraliaAustriaAzerbaijanBahamas, TheBahrainBangladeshBarbadosBelarusBelgiumBelizeBeninBermudaBhutanBoliviaBosnia and HerzegovinaBotswanaBrazilBritish Virgin IslandsBrunei DarussalamBulgariaBurkina FasoBurundiCabo VerdeCambodiaCameroonCanadaCaribbean small statesCayman IslandsCentral African RepublicCentral Europe and the BalticsChadChannel IslandsChileChinaColombiaComorosCongo, Dem. Rep.Congo, Rep.Costa RicaCote d'IvoireCroatiaCubaCuracaoCyprusCzech RepublicDenmarkDjiboutiDominicaDominican RepublicEarly-demographic dividendEast Asia & PacificEast Asia & Pacific (excluding high income)East Asia & Pacific (IDA & IBRD countries)EcuadorEgypt, Arab Rep.El SalvadorEquatorial GuineaEritreaEstoniaEthiopiaEuro areaEurope & Central AsiaEurope & Central Asia (excluding high income)Europe & Central Asia (IDA & IBRD countries)European UnionFaroe IslandsFijiFinlandFragile and conflict affected situationsFranceFrench PolynesiaGabonGambia, TheGeorgiaGermanyGhanaGibraltarGreeceGreenlandGrenadaGuamGuatemalaGuineaGuinea-BissauGuyanaHaitiHeavily indebted poor countries (HIPC)High incomeHondurasHong Kong SAR, ChinaHungaryIBRD onlyIcelandIDA & IBRD totalIDA blendIDA onlyIDA totalIndiaIndonesiaIran, Islamic Rep.IraqIrelandIsle of ManIsraelItalyJamaicaJapanJordanKazakhstanKenyaKiribatiKorea, Dem. People’s Rep.Korea, Rep.KuwaitKyrgyz RepublicLao PDRLate-demographic dividendLatin America & Caribbean Latin America & Caribbean (excluding high income)Latin America & the Caribbean (IDA & IBRD countries)LatviaLeast developed countries: UN classificationLebanonLesothoLiberiaLibyaLiechtensteinLithuaniaLow & middle incomeLow incomeLower middle incomeLuxembourgMacao SAR, ChinaMacedonia, FYRMadagascarMalawiMalaysiaMaldivesMaliMaltaMarshall IslandsMauritaniaMauritiusMexicoMicronesia, Fed. Sts.Middle East & North AfricaMiddle East & North Africa (excluding high income)Middle East & North Africa (IDA & IBRD countries)Middle incomeMoldovaMonacoMongoliaMontenegroMoroccoMozambiqueMyanmarNamibiaNauruNepalNetherlandsNew CaledoniaNew ZealandNicaraguaNigerNigeriaNorth AmericaNorthern Mariana IslandsNorwayOECD membersOmanOther small statesPacific island small statesPakistanPalauPanamaPapua New GuineaParaguayPeruPhilippinesPolandPortugalPost-demographic dividendPre-demographic dividendPuerto RicoQatarRomaniaRussian FederationRwandaSamoaSan MarinoSao Tome and PrincipeSaudi ArabiaSenegalSerbiaSeychellesSierra LeoneSingaporeSint Maarten (Dutch part)Slovak RepublicSloveniaSmall statesSolomon IslandsSomaliaSouth AfricaSouth AsiaSouth Asia (IDA & IBRD)South SudanSpainSri LankaSt. Kitts and NevisSt. LuciaSt. Vincent and the GrenadinesSub-Saharan Africa Sub-Saharan Africa (excluding high income)Sub-Saharan Africa (IDA & IBRD countries)SudanSurinameSwazilandSwedenSwitzerlandSyrian Arab RepublicTajikistanTanzaniaThailandTimor-LesteTogoTongaTrinidad and TobagoTunisiaTurkeyTurkmenistanTurks and Caicos IslandsTuvaluUgandaUkraineUnited Arab EmiratesUnited KingdomUnited StatesUpper middle incomeUruguayUzbekistanVanuatuVenezuela, RBVietnamVirgin Islands (U.S.)West Bank and GazaWorldYemen, Rep.ZambiaZimbabwe Linea del tempo:
Questa scala temporale mostra un grafico dal 1961 anno al 2016 anno. Micronesia, Fed. Sts.. I dati fino ad 1960 anno non disponibili. Il numero di osservazioni attuali secondo i date: 56.
La fonte (nome):
Indicatori dello sviluppo mondiale
La fonte (organizzazione):
World Bank Staff estimates based on United Nations, World Urbanization Prospects.
Categorie:
Agriculture & Rural Development
sono stati aggiornati
23 apr 2017 anni
Indicatori delle variazioni dei valori per anni
Minima:
73.555
1 gen 1981 anni
Massimo:
77.702
1 gen 2011 anni
Alla data di osservazione
Valore
Variazione assoluta
La variazione rispetto al valore precedente
1 gen 1961 anni
77.688
+77.688
0.0%
1 gen 1962 anni
77.447
-0.241
-0.31%
1 gen 1963 anni
77.203
-0.244
-0.32%
1 gen 1964 anni
76.958
-0.245
-0.32%
1 gen 1965 anni
76.711
-0.247
-0.32%
1 gen 1966 anni
76.463
-0.248
-0.32%
1 gen 1967 anni
76.212
-0.251
-0.33%
1 gen 1968 anni
75.96
-0.252
-0.33%
1 gen 1969 anni
75.705
-0.255
-0.34%
1 gen 1970 anni
75.449
-0.256
-0.34%
1 gen 1971 anni
75.192
-0.257
-0.34%
1 gen 1972 anni
74.932
-0.26
-0.35%
1 gen 1973 anni
74.67
-0.262
-0.35%
1 gen 1974 anni
74.407
-0.263
-0.35%
1 gen 1975 anni
74.259
-0.148
-0.2%
1 gen 1976 anni
74.142
-0.117
-0.16%
1 gen 1977 anni
74.025
-0.117
-0.16%
1 gen 1978 anni
73.908
-0.117
-0.16%
1 gen 1979 anni
73.791
-0.117
-0.16%
1 gen 1980 anni
73.673
-0.118
-0.16%
1 gen 1981 anni
73.555
-0.118
-0.16%
1 gen 1982 anni
73.583
+0.028
0.04%
1 gen 1983 anni
73.65
+0.067
0.09%
1 gen 1984 anni
73.717
+0.067
0.09%
1 gen 1985 anni
73.784
+0.067
0.09%
1 gen 1986 anni
73.851
+0.067
0.09%
1 gen 1987 anni
73.917
+0.066
0.09%
1 gen 1988 anni
73.984
+0.067
0.09%
1 gen 1989 anni
74.05
+0.066
0.09%
1 gen 1990 anni
74.116
+0.066
0.09%
1 gen 1991 anni
74.182
+0.066
0.09%
1 gen 1992 anni
74.248
+0.066
0.09%
1 gen 1993 anni
74.314
+0.066
0.09%
1 gen 1994 anni
74.38
+0.066
0.09%
1 gen 1995 anni
74.446
+0.066
0.09%
1 gen 1996 anni
74.932
+0.486
0.65%
1 gen 1997 anni
75.527
+0.595
0.79%
1 gen 1998 anni
76.111
+0.584
0.77%
1 gen 1999 anni
76.686
+0.575
0.76%
1 gen 2000 anni
77.251
+0.565
0.74%
1 gen 2001 anni
77.67
+0.419
0.54%
1 gen 2002 anni
77.67
0.0
0.0%
1 gen 2003 anni
77.67
0.0
0.0%
1 gen 2004 anni
77.67
0.0
0.0%
1 gen 2005 anni
77.67
0.0
0.0%
1 gen 2006 anni
77.67
0.0
0.0%
1 gen 2007 anni
77.676
+0.006
0.01%
1 gen 2008 anni
77.683
+0.007
0.01%
1 gen 2009 anni
77.689
+0.006
0.01%
1 gen 2010 anni
77.695
+0.006
0.01%
1 gen 2011 anni
77.702
+0.007
0.01%
1 gen 2012 anni
77.697
-0.005
-0.01%
1 gen 2013 anni
77.683
-0.014
-0.02%
1 gen 2014 anni
77.658
-0.025
-0.03%
1 gen 2015 anni
77.622
-0.036
-0.05%
1 gen 2016 anni
77.576
-0.046
-0.06%
Classificazione dei paesi secondo i statistiche attuali per anni


Commenti: