29
/it/
it
AIzaSyAYiBZKx7MnpbEhh9jyipgxe19OcubqV5w
April 1, 2024
255788
Swaziland
SWZ
true
2
1
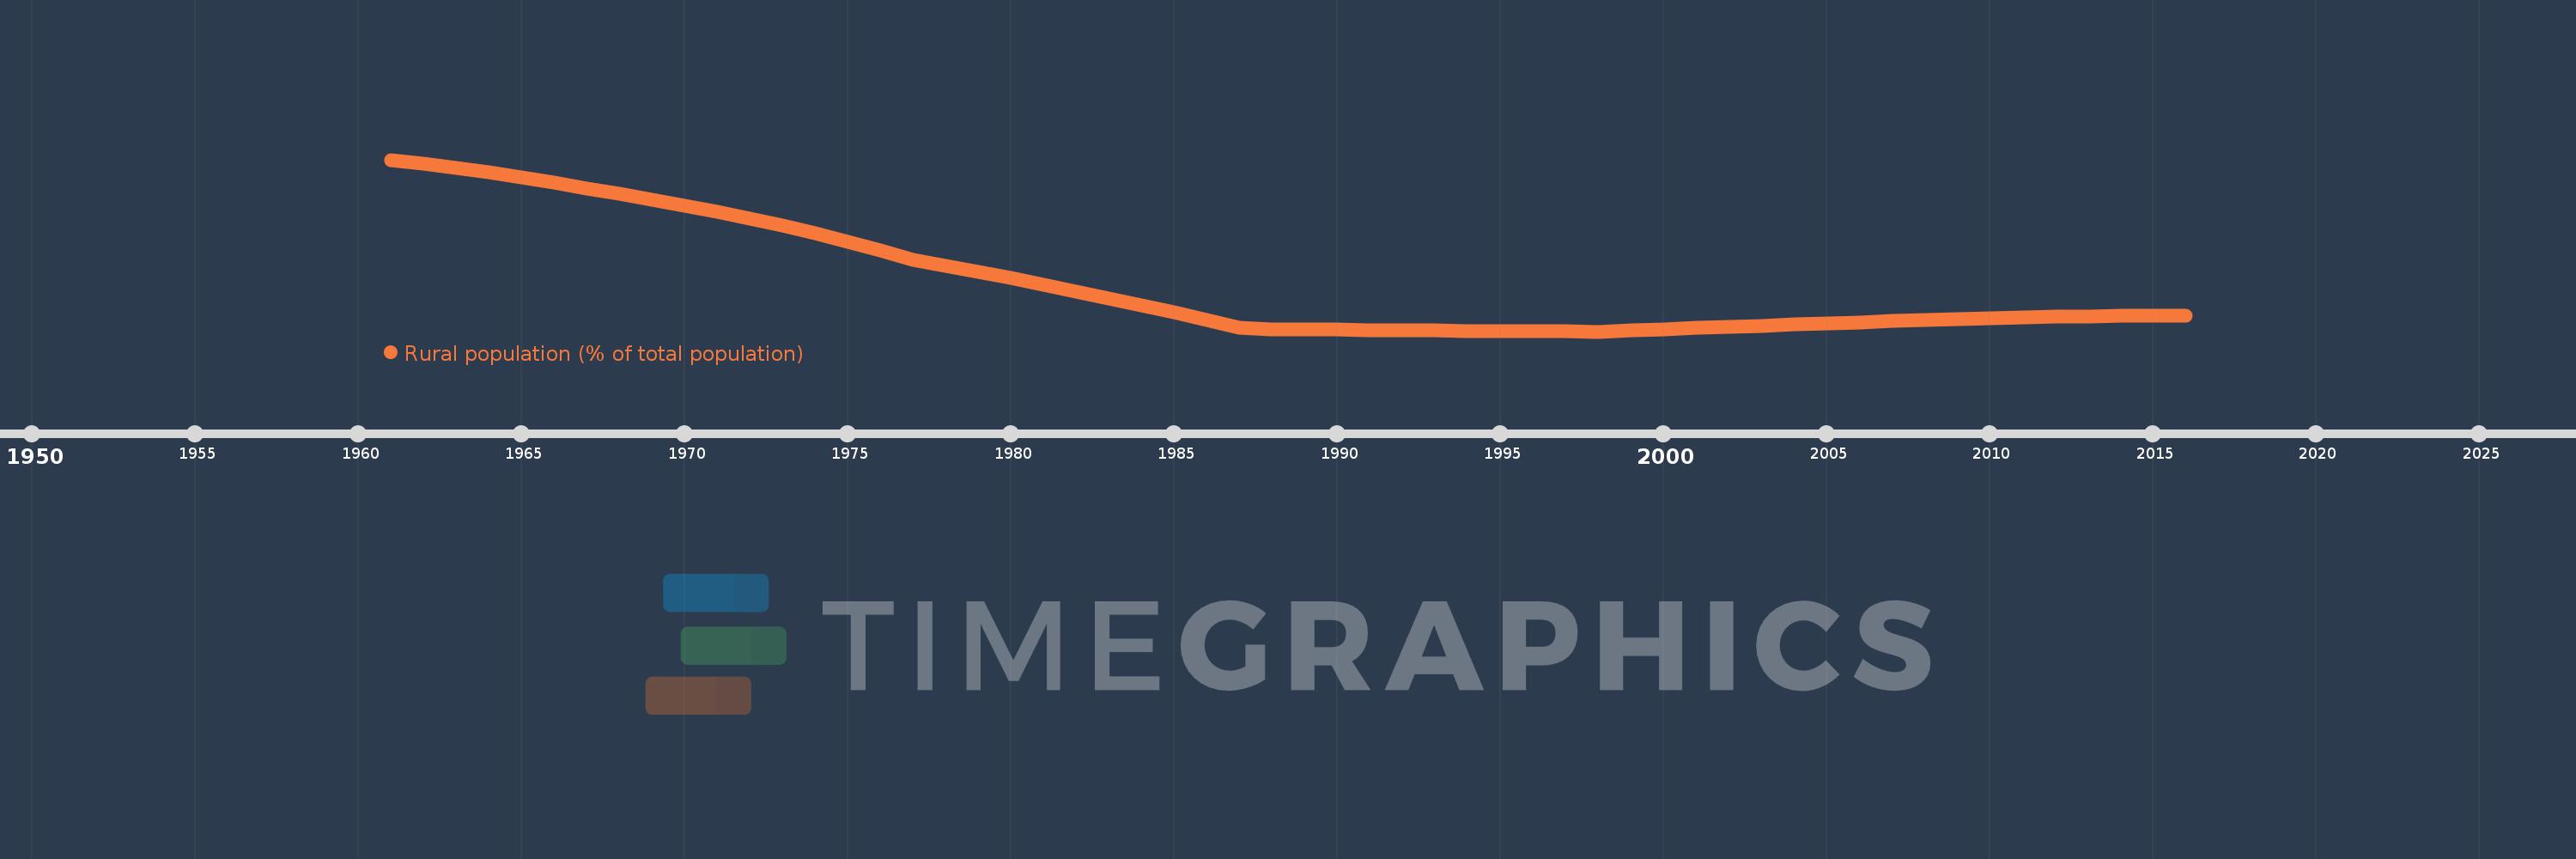
Rural population (% of total population)
2016,2015,2014,2013,2012,2011,2010,2009,2008,2007,2006,2005,2004,2003,2002,2001,2000,1999,1998,1997,1996,1995,1994,1993,1992,1991,1990,1989,1988,1987,1986,1985,1984,1983,1982,1981,1980,1979,1978,1977,1976,1975,1974,1973,1972,1971,1970,1969,1968,1967,1966,1965,1964,1963,1962,1961
Queste statistiche in altri paesi:
AfghanistanAlbaniaAlgeriaAmerican SamoaAndorraAngolaAntigua and BarbudaArab WorldArgentinaArmeniaArubaAustraliaAustriaAzerbaijanBahamas, TheBahrainBangladeshBarbadosBelarusBelgiumBelizeBeninBermudaBhutanBoliviaBosnia and HerzegovinaBotswanaBrazilBritish Virgin IslandsBrunei DarussalamBulgariaBurkina FasoBurundiCabo VerdeCambodiaCameroonCanadaCaribbean small statesCayman IslandsCentral African RepublicCentral Europe and the BalticsChadChannel IslandsChileChinaColombiaComorosCongo, Dem. Rep.Congo, Rep.Costa RicaCote d'IvoireCroatiaCubaCuracaoCyprusCzech RepublicDenmarkDjiboutiDominicaDominican RepublicEarly-demographic dividendEast Asia & PacificEast Asia & Pacific (excluding high income)East Asia & Pacific (IDA & IBRD countries)EcuadorEgypt, Arab Rep.El SalvadorEquatorial GuineaEritreaEstoniaEthiopiaEuro areaEurope & Central AsiaEurope & Central Asia (excluding high income)Europe & Central Asia (IDA & IBRD countries)European UnionFaroe IslandsFijiFinlandFragile and conflict affected situationsFranceFrench PolynesiaGabonGambia, TheGeorgiaGermanyGhanaGibraltarGreeceGreenlandGrenadaGuamGuatemalaGuineaGuinea-BissauGuyanaHaitiHeavily indebted poor countries (HIPC)High incomeHondurasHong Kong SAR, ChinaHungaryIBRD onlyIcelandIDA & IBRD totalIDA blendIDA onlyIDA totalIndiaIndonesiaIran, Islamic Rep.IraqIrelandIsle of ManIsraelItalyJamaicaJapanJordanKazakhstanKenyaKiribatiKorea, Dem. People’s Rep.Korea, Rep.KuwaitKyrgyz RepublicLao PDRLate-demographic dividendLatin America & Caribbean Latin America & Caribbean (excluding high income)Latin America & the Caribbean (IDA & IBRD countries)LatviaLeast developed countries: UN classificationLebanonLesothoLiberiaLibyaLiechtensteinLithuaniaLow & middle incomeLow incomeLower middle incomeLuxembourgMacao SAR, ChinaMacedonia, FYRMadagascarMalawiMalaysiaMaldivesMaliMaltaMarshall IslandsMauritaniaMauritiusMexicoMicronesia, Fed. Sts.Middle East & North AfricaMiddle East & North Africa (excluding high income)Middle East & North Africa (IDA & IBRD countries)Middle incomeMoldovaMonacoMongoliaMontenegroMoroccoMozambiqueMyanmarNamibiaNauruNepalNetherlandsNew CaledoniaNew ZealandNicaraguaNigerNigeriaNorth AmericaNorthern Mariana IslandsNorwayOECD membersOmanOther small statesPacific island small statesPakistanPalauPanamaPapua New GuineaParaguayPeruPhilippinesPolandPortugalPost-demographic dividendPre-demographic dividendPuerto RicoQatarRomaniaRussian FederationRwandaSamoaSan MarinoSao Tome and PrincipeSaudi ArabiaSenegalSerbiaSeychellesSierra LeoneSingaporeSint Maarten (Dutch part)Slovak RepublicSloveniaSmall statesSolomon IslandsSomaliaSouth AfricaSouth AsiaSouth Asia (IDA & IBRD)South SudanSpainSri LankaSt. Kitts and NevisSt. LuciaSt. Vincent and the GrenadinesSub-Saharan Africa Sub-Saharan Africa (excluding high income)Sub-Saharan Africa (IDA & IBRD countries)SudanSurinameSwazilandSwedenSwitzerlandSyrian Arab RepublicTajikistanTanzaniaThailandTimor-LesteTogoTongaTrinidad and TobagoTunisiaTurkeyTurkmenistanTurks and Caicos IslandsTuvaluUgandaUkraineUnited Arab EmiratesUnited KingdomUnited StatesUpper middle incomeUruguayUzbekistanVanuatuVenezuela, RBVietnamVirgin Islands (U.S.)West Bank and GazaWorldYemen, Rep.ZambiaZimbabwe Linea del tempo:
Questa scala temporale mostra un grafico dal 1961 anno al 2016 anno. Swaziland. I dati fino ad 1960 anno non disponibili. Il numero di osservazioni attuali secondo i date: 56.
La fonte (nome):
Indicatori dello sviluppo mondiale
La fonte (organizzazione):
World Bank Staff estimates based on United Nations, World Urbanization Prospects.
Categorie:
Agriculture & Rural Development
sono stati aggiornati
23 apr 2017 anni
Indicatori delle variazioni dei valori per anni
Minima:
76.919
1 gen 1998 anni
Massimo:
96.087
1 gen 1961 anni
Alla data di osservazione
Valore
Variazione assoluta
La variazione rispetto al valore precedente
1 gen 1961 anni
96.087
+96.087
0.0%
1 gen 1962 anni
95.665
-0.422
-0.44%
1 gen 1963 anni
95.2
-0.465
-0.49%
1 gen 1964 anni
94.688
-0.512
-0.54%
1 gen 1965 anni
94.124
-0.564
-0.6%
1 gen 1966 anni
93.506
-0.618
-0.66%
1 gen 1967 anni
92.843
-0.663
-0.71%
1 gen 1968 anni
92.271
-0.572
-0.62%
1 gen 1969 anni
91.656
-0.615
-0.67%
1 gen 1970 anni
90.999
-0.657
-0.72%
1 gen 1971 anni
90.295
-0.704
-0.77%
1 gen 1972 anni
89.542
-0.753
-0.83%
1 gen 1973 anni
88.736
-0.806
-0.9%
1 gen 1974 anni
87.88
-0.856
-0.96%
1 gen 1975 anni
86.967
-0.913
-1.04%
1 gen 1976 anni
85.996
-0.971
-1.12%
1 gen 1977 anni
84.963
-1.033
-1.2%
1 gen 1978 anni
84.247
-0.716
-0.84%
1 gen 1979 anni
83.573
-0.674
-0.8%
1 gen 1980 anni
82.876
-0.697
-0.83%
1 gen 1981 anni
82.154
-0.722
-0.87%
1 gen 1982 anni
81.411
-0.743
-0.9%
1 gen 1983 anni
80.643
-0.768
-0.94%
1 gen 1984 anni
79.851
-0.792
-0.98%
1 gen 1985 anni
79.035
-0.816
-1.02%
1 gen 1986 anni
78.196
-0.839
-1.06%
1 gen 1987 anni
77.332
-0.864
-1.1%
1 gen 1988 anni
77.176
-0.156
-0.2%
1 gen 1989 anni
77.148
-0.028
-0.04%
1 gen 1990 anni
77.12
-0.028
-0.04%
1 gen 1991 anni
77.092
-0.028
-0.04%
1 gen 1992 anni
77.065
-0.027
-0.04%
1 gen 1993 anni
77.036
-0.029
-0.04%
1 gen 1994 anni
77.008
-0.028
-0.04%
1 gen 1995 anni
76.98
-0.028
-0.04%
1 gen 1996 anni
76.952
-0.028
-0.04%
1 gen 1997 anni
76.924
-0.028
-0.04%
1 gen 1998 anni
76.919
-0.005
-0.01%
1 gen 1999 anni
77.051
+0.132
0.17%
1 gen 2000 anni
77.183
+0.132
0.17%
1 gen 2001 anni
77.314
+0.131
0.17%
1 gen 2002 anni
77.445
+0.131
0.17%
1 gen 2003 anni
77.575
+0.13
0.17%
1 gen 2004 anni
77.704
+0.129
0.17%
1 gen 2005 anni
77.834
+0.13
0.17%
1 gen 2006 anni
77.962
+0.128
0.16%
1 gen 2007 anni
78.09
+0.128
0.16%
1 gen 2008 anni
78.217
+0.127
0.16%
1 gen 2009 anni
78.33
+0.113
0.14%
1 gen 2010 anni
78.426
+0.096
0.12%
1 gen 2011 anni
78.508
+0.082
0.1%
1 gen 2012 anni
78.575
+0.067
0.09%
1 gen 2013 anni
78.626
+0.051
0.06%
1 gen 2014 anni
78.663
+0.037
0.05%
1 gen 2015 anni
78.685
+0.022
0.03%
1 gen 2016 anni
78.692
+0.007
0.01%
Classificazione dei paesi secondo i statistiche attuali per anni


Commenti: