29
/fr/
fr
AIzaSyAYiBZKx7MnpbEhh9jyipgxe19OcubqV5w
April 1, 2024
91180
Brazil
BRA
true
2
1
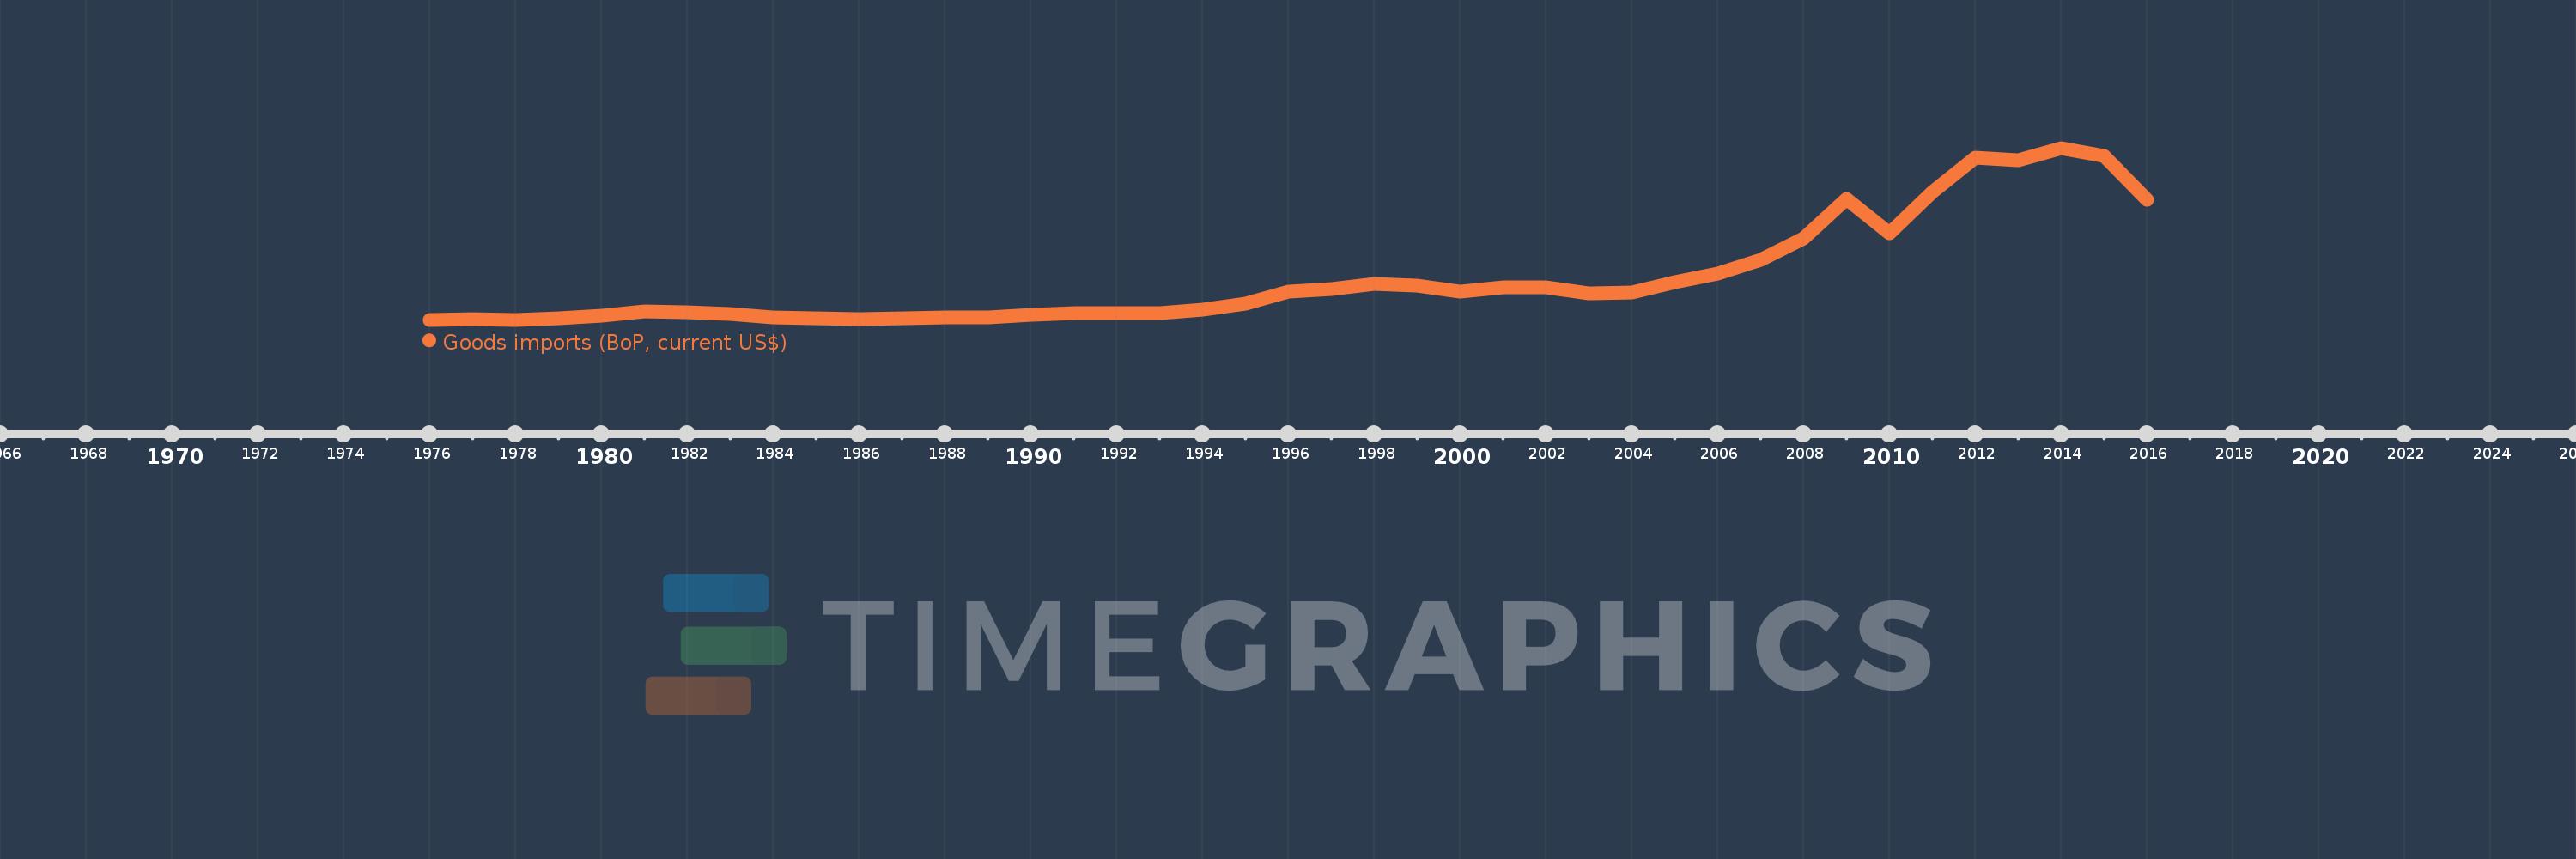
Goods imports (BoP, current US$)
2016,2015,2014,2013,2012,2011,2010,2009,2008,2007,2006,2005,2004,2003,2002,2001,2000,1999,1998,1997,1996,1995,1994,1993,1992,1991,1990,1989,1988,1987,1986,1985,1984,1983,1982,1981,1980,1979,1978,1977,1976
Cette statistique dans les autres pays:
AfghanistanAlbaniaAlgeriaAngolaAntigua and BarbudaArab WorldArgentinaArmeniaArubaAustraliaAustriaAzerbaijanBahamas, TheBahrainBangladeshBarbadosBelarusBelgiumBelizeBeninBermudaBhutanBoliviaBosnia and HerzegovinaBotswanaBrazilBrunei DarussalamBulgariaBurkina FasoBurundiCabo VerdeCambodiaCameroonCanadaCaribbean small statesCentral African RepublicCentral Europe and the BalticsChadChileChinaColombiaComorosCongo, Dem. Rep.Congo, Rep.Costa RicaCote d'IvoireCroatiaCuracaoCyprusCzech RepublicDenmarkDjiboutiDominicaDominican RepublicEarly-demographic dividendEast Asia & PacificEast Asia & Pacific (excluding high income)East Asia & Pacific (IDA & IBRD countries)EcuadorEgypt, Arab Rep.El SalvadorEquatorial GuineaEritreaEstoniaEthiopiaEuro areaEurope & Central AsiaEurope & Central Asia (excluding high income)Europe & Central Asia (IDA & IBRD countries)European UnionFaroe IslandsFijiFinlandFragile and conflict affected situationsFranceFrench PolynesiaGabonGambia, TheGeorgiaGermanyGhanaGreeceGrenadaGuatemalaGuineaGuinea-BissauGuyanaHaitiHeavily indebted poor countries (HIPC)High incomeHondurasHong Kong SAR, ChinaHungaryIBRD onlyIcelandIDA & IBRD totalIDA blendIDA onlyIDA totalIndiaIndonesiaIran, Islamic Rep.IraqIrelandIsraelItalyJamaicaJapanJordanKazakhstanKenyaKiribatiKorea, Rep.KosovoKuwaitKyrgyz RepublicLao PDRLate-demographic dividendLatin America & Caribbean Latin America & Caribbean (excluding high income)Latin America & the Caribbean (IDA & IBRD countries)LatviaLeast developed countries: UN classificationLebanonLesothoLiberiaLibyaLithuaniaLow & middle incomeLow incomeLower middle incomeLuxembourgMacao SAR, ChinaMacedonia, FYRMadagascarMalawiMalaysiaMaldivesMaliMaltaMarshall IslandsMauritaniaMauritiusMexicoMicronesia, Fed. Sts.Middle East & North Africa (excluding high income)Middle East & North Africa (IDA & IBRD countries)Middle incomeMoldovaMongoliaMontenegroMoroccoMozambiqueMyanmarNamibiaNepalNetherlandsNew CaledoniaNew ZealandNicaraguaNigerNigeriaNorth AmericaNorwayOECD membersOmanOther small statesPacific island small statesPakistanPalauPanamaPapua New GuineaParaguayPeruPhilippinesPolandPortugalPost-demographic dividendPre-demographic dividendQatarRomaniaRussian FederationRwandaSamoaSao Tome and PrincipeSaudi ArabiaSenegalSerbiaSeychellesSierra LeoneSingaporeSint Maarten (Dutch part)Slovak RepublicSloveniaSmall statesSolomon IslandsSouth AfricaSouth AsiaSouth Asia (IDA & IBRD)South SudanSpainSri LankaSt. Kitts and NevisSt. LuciaSt. Vincent and the GrenadinesSub-Saharan Africa Sub-Saharan Africa (excluding high income)Sub-Saharan Africa (IDA & IBRD countries)SudanSurinameSwazilandSwedenSwitzerlandSyrian Arab RepublicTajikistanTanzaniaThailandTimor-LesteTogoTongaTrinidad and TobagoTunisiaTurkeyTuvaluUgandaUkraineUnited KingdomUnited StatesUpper middle incomeUruguayVanuatuVenezuela, RBVietnamWest Bank and GazaWorldYemen, Rep.ZambiaZimbabwe La ligne de temps
Cette échelle de temps montre un graphique de 1976 année à 2016 année Brazil. Les données jusqu'à 1975 année ne sont pas présentés. Quantité d'observations actuelles selon dates: 41.
Source (désignation):
Les indicateurs du développement mondiale
Source (organisation):
International Monetary Fund, Balance of Payments Statistics Yearbook and data files.
Catégories:
Economy & Growth, Trade
Dernière mise à jour
23 avr. 2017
Les indicateurs de changement de valeurs selon les années
Minimum:
12.023 mds
1 janv. 1978
Maximum:
241.189 mds
1 janv. 2014
Pour la date d''observation
Valeur
Changement absolu
Le changement par rapport à la valeur précédente
1 janv. 1976
12.042 mds
+12.042 mds
0.0%
1 janv. 1977
12.347 mds
+305.0 mln.
2.53%
1 janv. 1978
12.023 mds
-324.0 mln.
-2.62%
1 janv. 1979
13.631 mds
+1.608 mds
13.37%
1 janv. 1980
17.961 mds
+4.33 mds
31.77%
1 janv. 1981
22.955 mds
+4.994 mds
27.8%
1 janv. 1982
22.091 mds
-864.0 mln.
-3.76%
1 janv. 1983
19.395 mds
-2.696 mds
-12.2%
1 janv. 1984
15.429 mds
-3.966 mds
-20.45%
1 janv. 1985
13.916 mds
-1.513 mds
-9.81%
1 janv. 1986
13.168 mds
-748.0 mln.
-5.38%
1 janv. 1987
14.044 mds
+876.0 mln.
6.65%
1 janv. 1988
15.052 mds
+1.008 mds
7.18%
1 janv. 1989
14.605 mds
-447.0 mln.
-2.97%
1 janv. 1990
18.263 mds
+3.658 mds
25.05%
1 janv. 1991
20.661 mds
+2.398 mds
13.13%
1 janv. 1992
21.041 mds
+380.0 mln.
1.84%
1 janv. 1993
20.554 mds
-487.0 mln.
-2.31%
1 janv. 1994
25.301 mds
+4.747 mds
23.1%
1 janv. 1995
33.241 mds
+7.94 mds
31.38%
1 janv. 1996
49.663 mds
+16.422 mds
49.4%
1 janv. 1997
53.301 mds
+3.638 mds
7.33%
1 janv. 1998
59.838 mds
+6.537 mds
12.26%
1 janv. 1999
57.711 mds
-2.127 mds
-3.55%
1 janv. 2000
49.009 mds
-8.702 mds
-15.08%
1 janv. 2001
55.311 mds
+6.302 mds
12.86%
1 janv. 2002
54.981 mds
-330.249 mln.
-0.6%
1 janv. 2003
46.704 mds
-8.277 mds
-15.05%
1 janv. 2004
47.809 mds
+1.106 mds
2.37%
1 janv. 2005
62.348 mds
+14.539 mds
30.41%
1 janv. 2006
73.14 mds
+10.792 mds
17.31%
1 janv. 2007
91.35 mds
+18.21 mds
24.9%
1 janv. 2008
120.617 mds
+29.268 mds
32.04%
1 janv. 2009
173.107 mds
+52.489 mds
43.52%
1 janv. 2010
127.723 mds
-45.383 mds
-26.22%
1 janv. 2011
182.833 mds
+55.11 mds
43.15%
1 janv. 2012
227.881 mds
+45.048 mds
24.64%
1 janv. 2013
224.864 mds
-3.017 mds
-1.32%
1 janv. 2014
241.189 mds
+16.325 mds
7.26%
1 janv. 2015
230.727 mds
-10.462 mds
-4.34%
1 janv. 2016
172.422 mds
-58.305 mds
-25.27%
Classement des pays selon les statistiques actuelles par années


Commentaires: