29
/fr/
fr
AIzaSyAYiBZKx7MnpbEhh9jyipgxe19OcubqV5w
April 1, 2024
84124
Benin
BEN
true
2
1
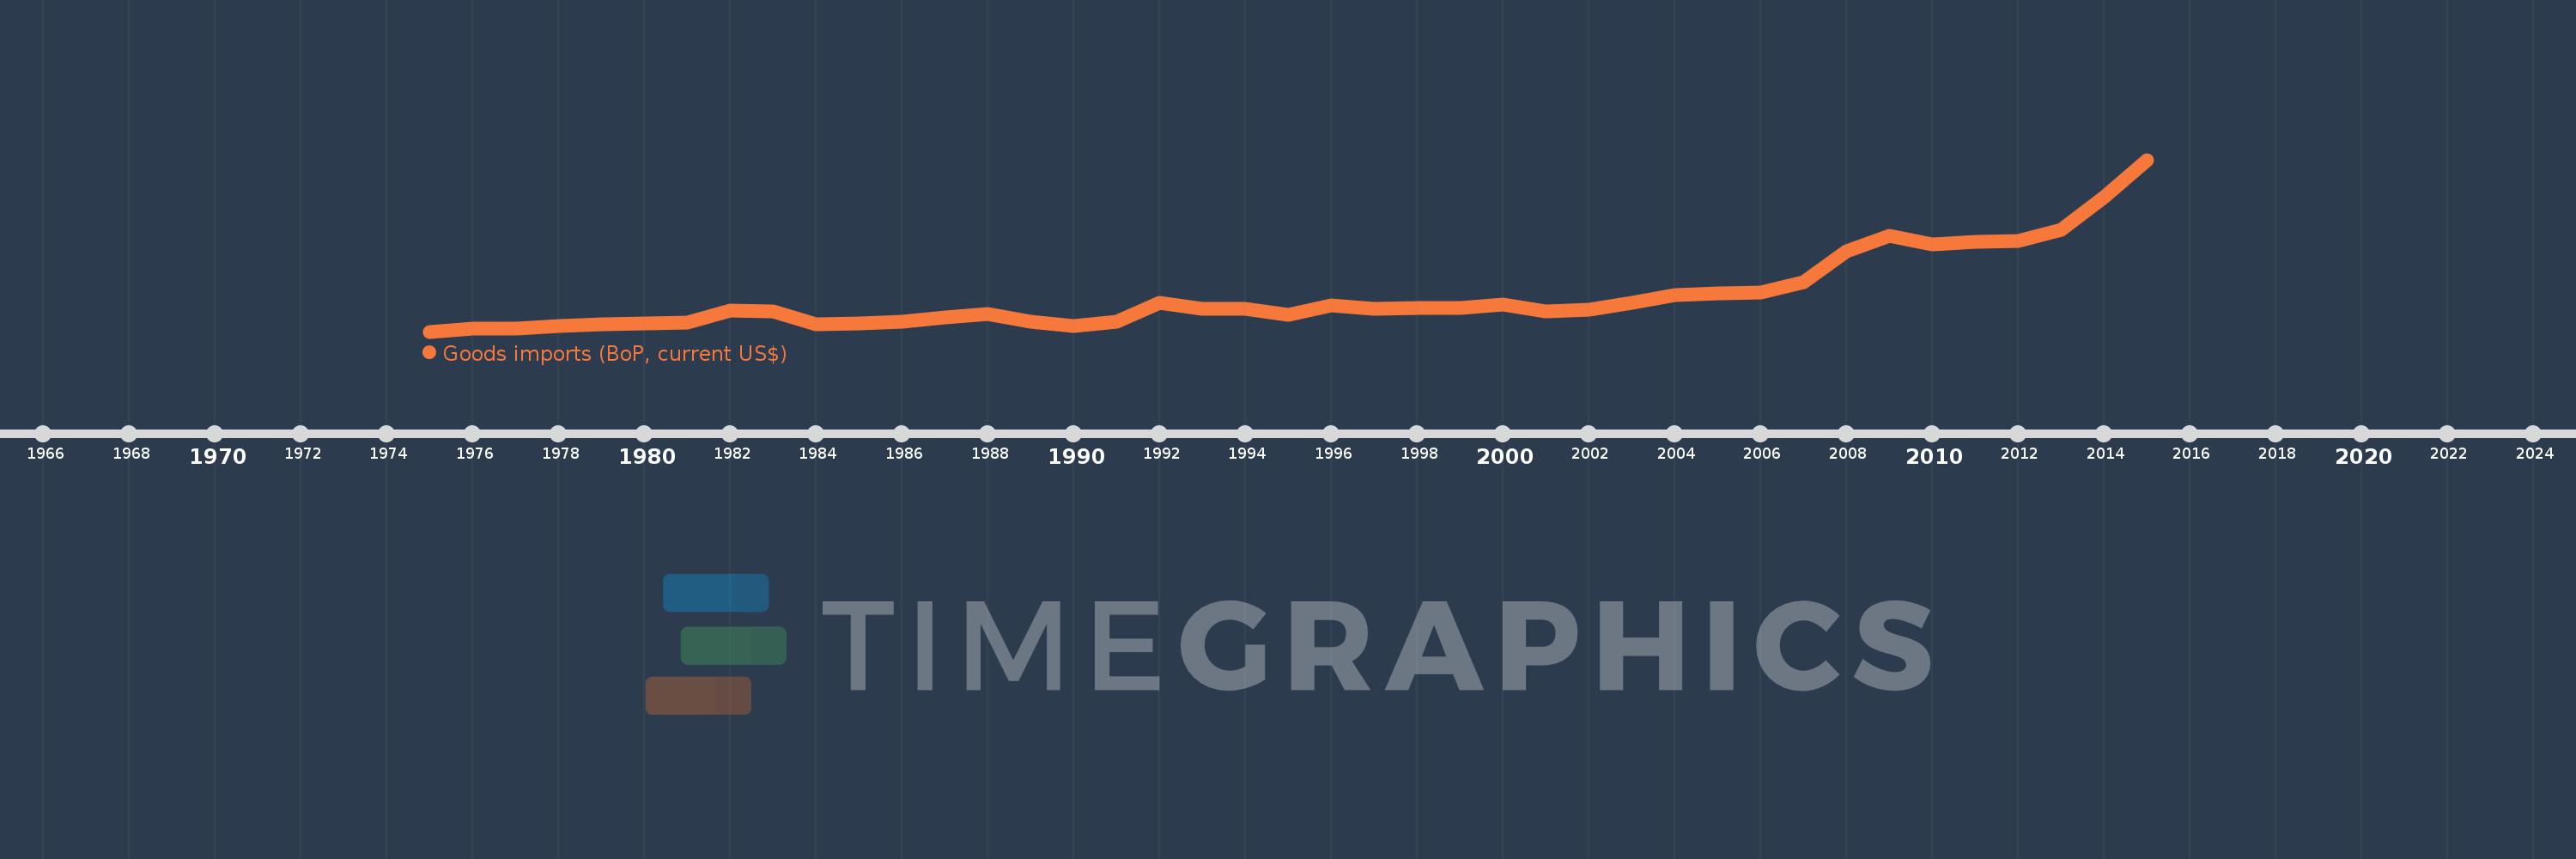
Goods imports (BoP, current US$)
2015,2014,2013,2012,2011,2010,2009,2008,2007,2006,2005,2004,2003,2002,2001,2000,1999,1998,1997,1996,1995,1994,1993,1992,1991,1990,1989,1988,1987,1986,1985,1984,1983,1982,1981,1980,1979,1978,1977,1976,1975
Cette statistique dans les autres pays:
AfghanistanAlbaniaAlgeriaAngolaAntigua and BarbudaArab WorldArgentinaArmeniaArubaAustraliaAustriaAzerbaijanBahamas, TheBahrainBangladeshBarbadosBelarusBelgiumBelizeBeninBermudaBhutanBoliviaBosnia and HerzegovinaBotswanaBrazilBrunei DarussalamBulgariaBurkina FasoBurundiCabo VerdeCambodiaCameroonCanadaCaribbean small statesCentral African RepublicCentral Europe and the BalticsChadChileChinaColombiaComorosCongo, Dem. Rep.Congo, Rep.Costa RicaCote d'IvoireCroatiaCuracaoCyprusCzech RepublicDenmarkDjiboutiDominicaDominican RepublicEarly-demographic dividendEast Asia & PacificEast Asia & Pacific (excluding high income)East Asia & Pacific (IDA & IBRD countries)EcuadorEgypt, Arab Rep.El SalvadorEquatorial GuineaEritreaEstoniaEthiopiaEuro areaEurope & Central AsiaEurope & Central Asia (excluding high income)Europe & Central Asia (IDA & IBRD countries)European UnionFaroe IslandsFijiFinlandFragile and conflict affected situationsFranceFrench PolynesiaGabonGambia, TheGeorgiaGermanyGhanaGreeceGrenadaGuatemalaGuineaGuinea-BissauGuyanaHaitiHeavily indebted poor countries (HIPC)High incomeHondurasHong Kong SAR, ChinaHungaryIBRD onlyIcelandIDA & IBRD totalIDA blendIDA onlyIDA totalIndiaIndonesiaIran, Islamic Rep.IraqIrelandIsraelItalyJamaicaJapanJordanKazakhstanKenyaKiribatiKorea, Rep.KosovoKuwaitKyrgyz RepublicLao PDRLate-demographic dividendLatin America & Caribbean Latin America & Caribbean (excluding high income)Latin America & the Caribbean (IDA & IBRD countries)LatviaLeast developed countries: UN classificationLebanonLesothoLiberiaLibyaLithuaniaLow & middle incomeLow incomeLower middle incomeLuxembourgMacao SAR, ChinaMacedonia, FYRMadagascarMalawiMalaysiaMaldivesMaliMaltaMarshall IslandsMauritaniaMauritiusMexicoMicronesia, Fed. Sts.Middle East & North Africa (excluding high income)Middle East & North Africa (IDA & IBRD countries)Middle incomeMoldovaMongoliaMontenegroMoroccoMozambiqueMyanmarNamibiaNepalNetherlandsNew CaledoniaNew ZealandNicaraguaNigerNigeriaNorth AmericaNorwayOECD membersOmanOther small statesPacific island small statesPakistanPalauPanamaPapua New GuineaParaguayPeruPhilippinesPolandPortugalPost-demographic dividendPre-demographic dividendQatarRomaniaRussian FederationRwandaSamoaSao Tome and PrincipeSaudi ArabiaSenegalSerbiaSeychellesSierra LeoneSingaporeSint Maarten (Dutch part)Slovak RepublicSloveniaSmall statesSolomon IslandsSouth AfricaSouth AsiaSouth Asia (IDA & IBRD)South SudanSpainSri LankaSt. Kitts and NevisSt. LuciaSt. Vincent and the GrenadinesSub-Saharan Africa Sub-Saharan Africa (excluding high income)Sub-Saharan Africa (IDA & IBRD countries)SudanSurinameSwazilandSwedenSwitzerlandSyrian Arab RepublicTajikistanTanzaniaThailandTimor-LesteTogoTongaTrinidad and TobagoTunisiaTurkeyTuvaluUgandaUkraineUnited KingdomUnited StatesUpper middle incomeUruguayVanuatuVenezuela, RBVietnamWest Bank and GazaWorldYemen, Rep.ZambiaZimbabwe La ligne de temps
Cette échelle de temps montre un graphique de 1975 année à 2015 année Benin. Les données jusqu'à 1974 année ne sont pas présentés. Quantité d'observations actuelles selon dates: 41.
Source (désignation):
Les indicateurs du développement mondiale
Source (organisation):
International Monetary Fund, Balance of Payments Statistics Yearbook and data files.
Catégories:
Economy & Growth, Trade
Dernière mise à jour
23 avr. 2017
Les indicateurs de changement de valeurs selon les années
Minimum:
148.265 mln.
1 janv. 1975
Maximum:
3.273 mds
1 janv. 2015
Pour la date d''observation
Valeur
Changement absolu
Le changement par rapport à la valeur précédente
1 janv. 1975
148.265 mln.
+148.265 mln.
0.0%
1 janv. 1976
205.634 mln.
+57.369 mln.
38.69%
1 janv. 1977
208.57 mln.
+2.936 mln.
1.43%
1 janv. 1978
255.512 mln.
+46.941 mln.
22.51%
1 janv. 1979
284.765 mln.
+29.254 mln.
11.45%
1 janv. 1980
288.96 mln.
+4.194 mln.
1.47%
1 janv. 1981
312.24 mln.
+23.281 mln.
8.06%
1 janv. 1982
526.8 mln.
+214.559 mln.
68.72%
1 janv. 1983
514.461 mln.
-12.339 mln.
-2.34%
1 janv. 1984
286.341 mln.
-228.119 mln.
-44.34%
1 janv. 1985
290.876 mln.
+4.534 mln.
1.58%
1 janv. 1986
326.312 mln.
+35.437 mln.
12.18%
1 janv. 1987
402.246 mln.
+75.933 mln.
23.27%
1 janv. 1988
463.172 mln.
+60.926 mln.
15.15%
1 janv. 1989
331.352 mln.
-131.82 mln.
-28.46%
1 janv. 1990
250.57 mln.
-80.782 mln.
-24.38%
1 janv. 1991
323.369 mln.
+72.799 mln.
29.05%
1 janv. 1992
673.369 mln.
+350.0 mln.
108.24%
1 janv. 1993
560.538 mln.
-112.831 mln.
-16.76%
1 janv. 1994
561.358 mln.
+820.121 milles
0.15%
1 janv. 1995
451.504 mln.
-109.855 mln.
-19.57%
1 janv. 1996
622.455 mln.
+170.951 mln.
37.86%
1 janv. 1997
557.8 mln.
-64.655 mln.
-10.39%
1 janv. 1998
576.868 mln.
+19.069 mln.
3.42%
1 janv. 1999
572.395 mln.
-4.474 mln.
-0.78%
1 janv. 2000
632.778 mln.
+60.383 mln.
10.55%
1 janv. 2001
514.772 mln.
-118.006 mln.
-18.65%
1 janv. 2002
552.828 mln.
+38.055 mln.
7.39%
1 janv. 2003
677.954 mln.
+125.126 mln.
22.63%
1 janv. 2004
818.528 mln.
+140.574 mln.
20.74%
1 janv. 2005
839.733 mln.
+21.205 mln.
2.59%
1 janv. 2006
863.363 mln.
+23.63 mln.
2.81%
1 janv. 2007
1.042 mds
+178.601 mln.
20.69%
1 janv. 2008
1.602 mds
+559.628 mln.
53.71%
1 janv. 2009
1.89 mds
+288.118 mln.
17.99%
1 janv. 2010
1.738 mds
-151.938 mln.
-8.04%
1 janv. 2011
1.775 mds
+37.404 mln.
2.15%
1 janv. 2012
1.8 mds
+25.177 mln.
1.42%
1 janv. 2013
2.002 mds
+201.739 mln.
11.21%
1 janv. 2014
2.594 mds
+591.614 mln.
29.55%
1 janv. 2015
3.273 mds
+678.989 mln.
26.18%
Classement des pays selon les statistiques actuelles par années


Commentaires: