29
/fr/
fr
AIzaSyAYiBZKx7MnpbEhh9jyipgxe19OcubqV5w
April 1, 2024
238292
Seychelles
SYC
true
2
1
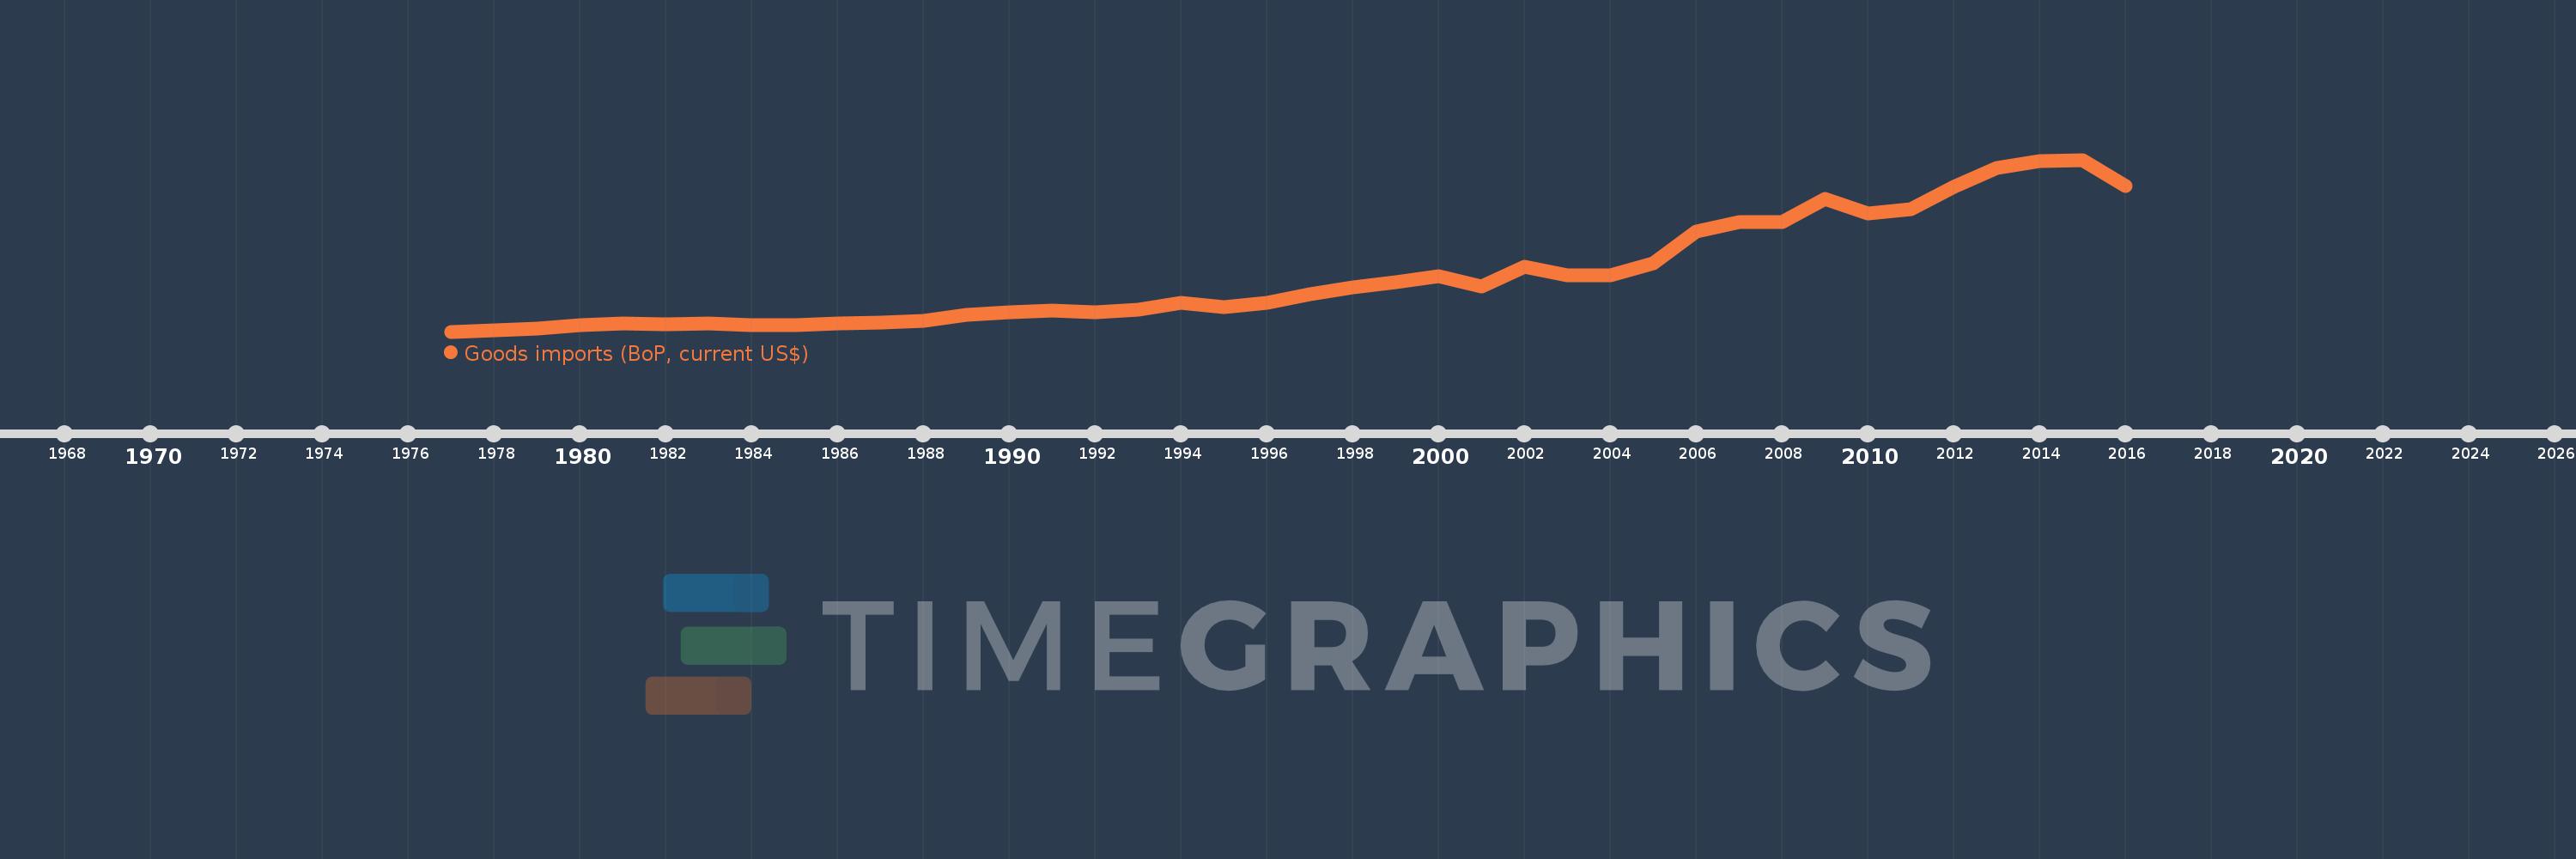
Goods imports (BoP, current US$)
2016,2015,2014,2013,2012,2011,2010,2009,2008,2007,2006,2005,2004,2003,2002,2001,2000,1999,1998,1997,1996,1995,1994,1993,1992,1991,1990,1989,1988,1987,1986,1985,1984,1983,1982,1981,1980,1979,1978,1977
Cette statistique dans les autres pays:
AfghanistanAlbaniaAlgeriaAngolaAntigua and BarbudaArab WorldArgentinaArmeniaArubaAustraliaAustriaAzerbaijanBahamas, TheBahrainBangladeshBarbadosBelarusBelgiumBelizeBeninBermudaBhutanBoliviaBosnia and HerzegovinaBotswanaBrazilBrunei DarussalamBulgariaBurkina FasoBurundiCabo VerdeCambodiaCameroonCanadaCaribbean small statesCentral African RepublicCentral Europe and the BalticsChadChileChinaColombiaComorosCongo, Dem. Rep.Congo, Rep.Costa RicaCote d'IvoireCroatiaCuracaoCyprusCzech RepublicDenmarkDjiboutiDominicaDominican RepublicEarly-demographic dividendEast Asia & PacificEast Asia & Pacific (excluding high income)East Asia & Pacific (IDA & IBRD countries)EcuadorEgypt, Arab Rep.El SalvadorEquatorial GuineaEritreaEstoniaEthiopiaEuro areaEurope & Central AsiaEurope & Central Asia (excluding high income)Europe & Central Asia (IDA & IBRD countries)European UnionFaroe IslandsFijiFinlandFragile and conflict affected situationsFranceFrench PolynesiaGabonGambia, TheGeorgiaGermanyGhanaGreeceGrenadaGuatemalaGuineaGuinea-BissauGuyanaHaitiHeavily indebted poor countries (HIPC)High incomeHondurasHong Kong SAR, ChinaHungaryIBRD onlyIcelandIDA & IBRD totalIDA blendIDA onlyIDA totalIndiaIndonesiaIran, Islamic Rep.IraqIrelandIsraelItalyJamaicaJapanJordanKazakhstanKenyaKiribatiKorea, Rep.KosovoKuwaitKyrgyz RepublicLao PDRLate-demographic dividendLatin America & Caribbean Latin America & Caribbean (excluding high income)Latin America & the Caribbean (IDA & IBRD countries)LatviaLeast developed countries: UN classificationLebanonLesothoLiberiaLibyaLithuaniaLow & middle incomeLow incomeLower middle incomeLuxembourgMacao SAR, ChinaMacedonia, FYRMadagascarMalawiMalaysiaMaldivesMaliMaltaMarshall IslandsMauritaniaMauritiusMexicoMicronesia, Fed. Sts.Middle East & North Africa (excluding high income)Middle East & North Africa (IDA & IBRD countries)Middle incomeMoldovaMongoliaMontenegroMoroccoMozambiqueMyanmarNamibiaNepalNetherlandsNew CaledoniaNew ZealandNicaraguaNigerNigeriaNorth AmericaNorwayOECD membersOmanOther small statesPacific island small statesPakistanPalauPanamaPapua New GuineaParaguayPeruPhilippinesPolandPortugalPost-demographic dividendPre-demographic dividendQatarRomaniaRussian FederationRwandaSamoaSao Tome and PrincipeSaudi ArabiaSenegalSerbiaSeychellesSierra LeoneSingaporeSint Maarten (Dutch part)Slovak RepublicSloveniaSmall statesSolomon IslandsSouth AfricaSouth AsiaSouth Asia (IDA & IBRD)South SudanSpainSri LankaSt. Kitts and NevisSt. LuciaSt. Vincent and the GrenadinesSub-Saharan Africa Sub-Saharan Africa (excluding high income)Sub-Saharan Africa (IDA & IBRD countries)SudanSurinameSwazilandSwedenSwitzerlandSyrian Arab RepublicTajikistanTanzaniaThailandTimor-LesteTogoTongaTrinidad and TobagoTunisiaTurkeyTuvaluUgandaUkraineUnited KingdomUnited StatesUpper middle incomeUruguayVanuatuVenezuela, RBVietnamWest Bank and GazaWorldYemen, Rep.ZambiaZimbabwe La ligne de temps
Cette échelle de temps montre un graphique de 1977 année à 2016 année Seychelles. Les données jusqu'à 1976 année ne sont pas présentés. Quantité d'observations actuelles selon dates: 40.
Source (désignation):
Les indicateurs du développement mondiale
Source (organisation):
International Monetary Fund, Balance of Payments Statistics Yearbook and data files.
Catégories:
Economy & Growth, Trade
Dernière mise à jour
23 avr. 2017
Les indicateurs de changement de valeurs selon les années
Minimum:
33.186 mln.
1 janv. 1977
Maximum:
1.081 mds
1 janv. 2015
Pour la date d''observation
Valeur
Changement absolu
Le changement par rapport à la valeur précédente
1 janv. 1977
33.186 mln.
+33.186 mln.
0.0%
1 janv. 1978
38.635 mln.
+5.449 mln.
16.42%
1 janv. 1979
51.823 mln.
+13.189 mln.
34.14%
1 janv. 1980
71.577 mln.
+19.754 mln.
38.12%
1 janv. 1981
83.659 mln.
+12.082 mln.
16.88%
1 janv. 1982
79.193 mln.
-4.466 mln.
-5.34%
1 janv. 1983
83.004 mln.
+3.811 mln.
4.81%
1 janv. 1984
74.499 mln.
-8.505 mln.
-10.25%
1 janv. 1985
73.94 mln.
-558.773 milles
-0.75%
1 janv. 1986
84.136 mln.
+10.196 mln.
13.79%
1 janv. 1987
89.343 mln.
+5.206 mln.
6.19%
1 janv. 1988
96.249 mln.
+6.906 mln.
7.73%
1 janv. 1989
134.961 mln.
+38.712 mln.
40.22%
1 janv. 1990
151.824 mln.
+16.863 mln.
12.49%
1 janv. 1991
163.83 mln.
+12.006 mln.
7.91%
1 janv. 1992
151.183 mln.
-12.646 mln.
-7.72%
1 janv. 1993
167.056 mln.
+15.873 mln.
10.5%
1 janv. 1994
208.587 mln.
+41.531 mln.
24.86%
1 janv. 1995
180.345 mln.
-28.242 mln.
-13.54%
1 janv. 1996
208.128 mln.
+27.783 mln.
15.41%
1 janv. 1997
261.087 mln.
+52.959 mln.
25.45%
1 janv. 1998
301.213 mln.
+40.126 mln.
15.37%
1 janv. 1999
334.632 mln.
+33.419 mln.
11.09%
1 janv. 2000
368.681 mln.
+34.049 mln.
10.17%
1 janv. 2001
308.936 mln.
-59.745 mln.
-16.21%
1 janv. 2002
426.913 mln.
+117.977 mln.
38.19%
1 janv. 2003
378.759 mln.
-48.154 mln.
-11.28%
1 janv. 2004
374.21 mln.
-4.549 mln.
-1.2%
1 janv. 2005
451.409 mln.
+77.199 mln.
20.63%
1 janv. 2006
644.554 mln.
+193.145 mln.
42.79%
1 janv. 2007
701.766 mln.
+57.212 mln.
8.88%
1 janv. 2008
701.888 mln.
+122.099 milles
0.02%
1 janv. 2009
841.11 mln.
+139.222 mln.
19.84%
1 janv. 2010
750.668 mln.
-90.442 mln.
-10.75%
1 janv. 2011
781.249 mln.
+30.582 mln.
4.07%
1 janv. 2012
915.004 mln.
+133.755 mln.
17.12%
1 janv. 2013
1.029 mds
+113.577 mln.
12.41%
1 janv. 2014
1.075 mds
+46.069 mln.
4.48%
1 janv. 2015
1.081 mds
+5.932 mln.
0.55%
1 janv. 2016
922.387 mln.
-158.194 mln.
-14.64%
Classement des pays selon les statistiques actuelles par années


Commentaires: