29
/fr/
fr
AIzaSyAYiBZKx7MnpbEhh9jyipgxe19OcubqV5w
April 1, 2024
89838
Botswana
BWA
true
2
1
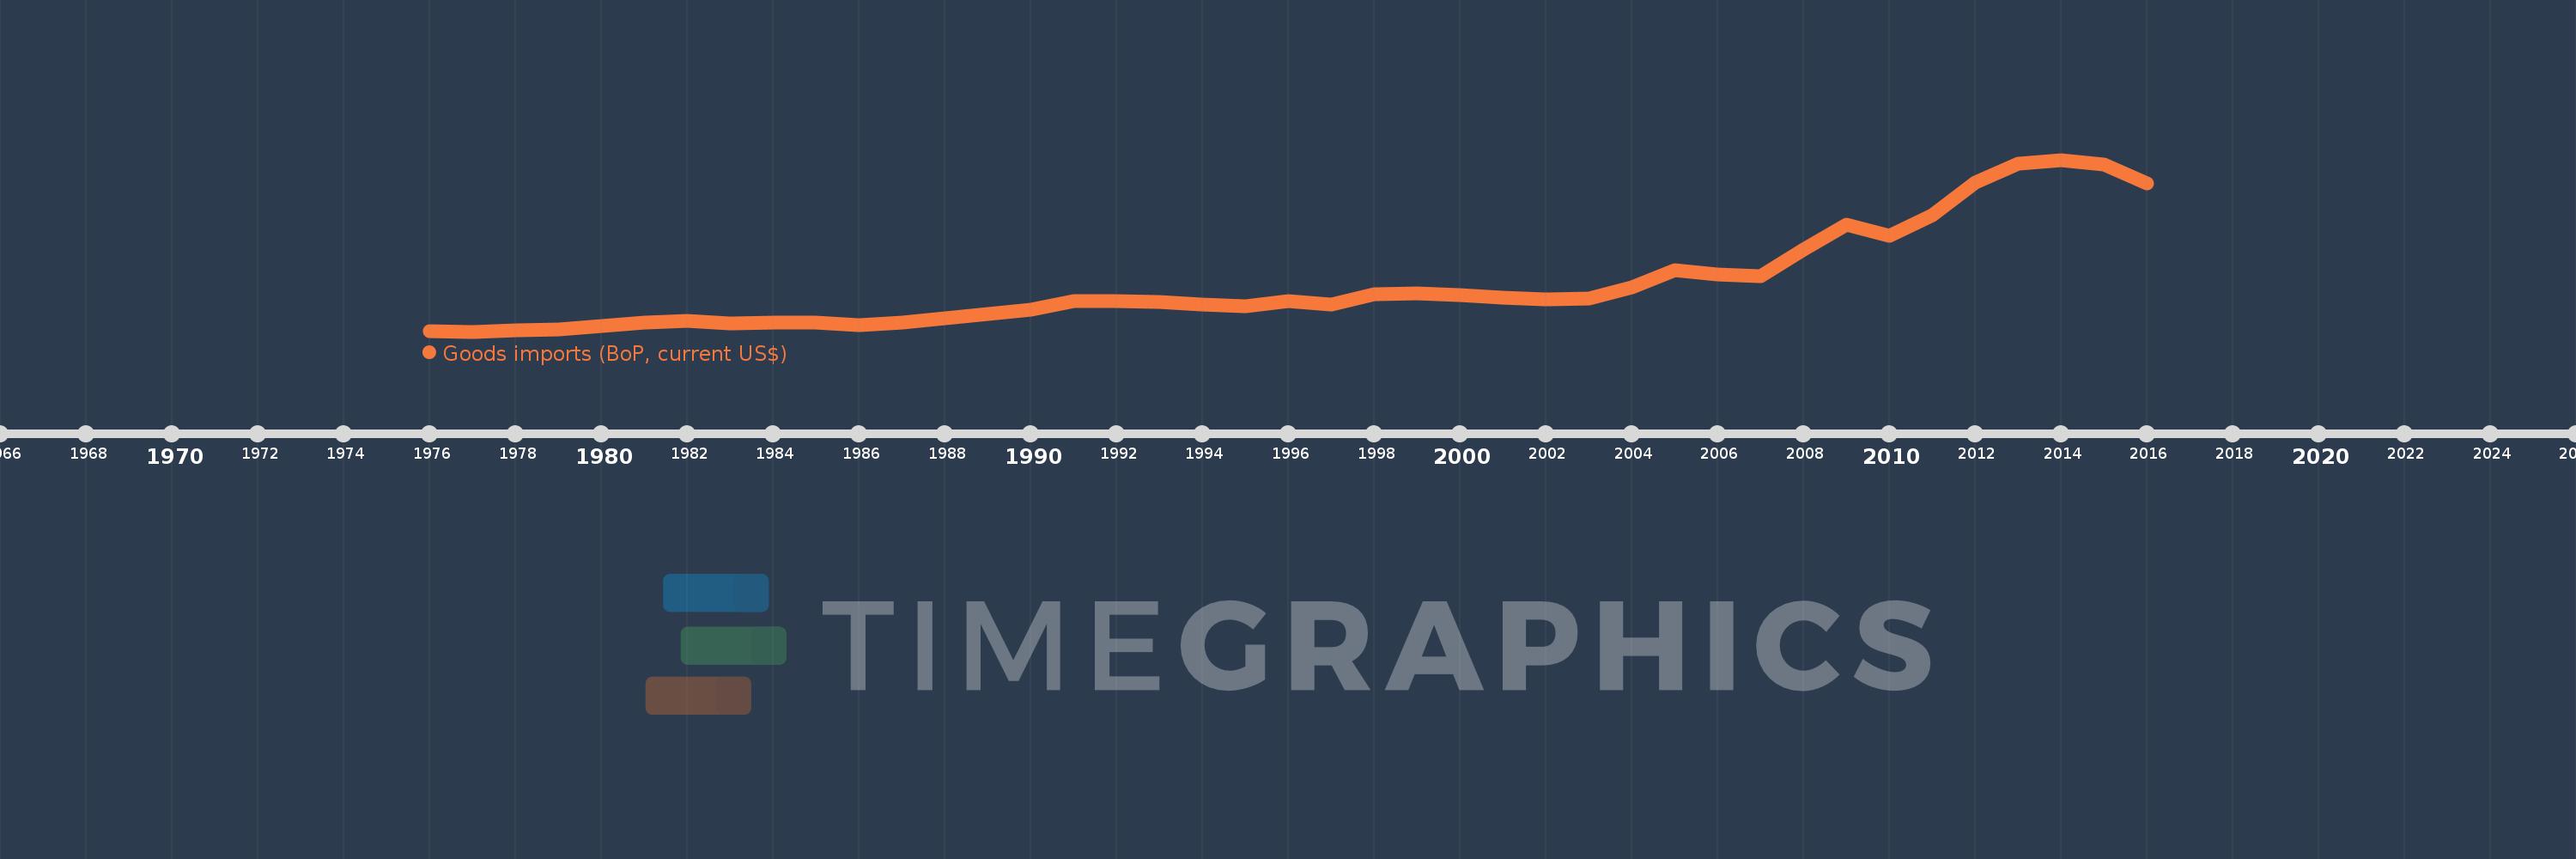
Goods imports (BoP, current US$)
2016,2015,2014,2013,2012,2011,2010,2009,2008,2007,2006,2005,2004,2003,2002,2001,2000,1999,1998,1997,1996,1995,1994,1993,1992,1991,1990,1989,1988,1987,1986,1985,1984,1983,1982,1981,1980,1979,1978,1977,1976
Cette statistique dans les autres pays:
AfghanistanAlbaniaAlgeriaAngolaAntigua and BarbudaArab WorldArgentinaArmeniaArubaAustraliaAustriaAzerbaijanBahamas, TheBahrainBangladeshBarbadosBelarusBelgiumBelizeBeninBermudaBhutanBoliviaBosnia and HerzegovinaBotswanaBrazilBrunei DarussalamBulgariaBurkina FasoBurundiCabo VerdeCambodiaCameroonCanadaCaribbean small statesCentral African RepublicCentral Europe and the BalticsChadChileChinaColombiaComorosCongo, Dem. Rep.Congo, Rep.Costa RicaCote d'IvoireCroatiaCuracaoCyprusCzech RepublicDenmarkDjiboutiDominicaDominican RepublicEarly-demographic dividendEast Asia & PacificEast Asia & Pacific (excluding high income)East Asia & Pacific (IDA & IBRD countries)EcuadorEgypt, Arab Rep.El SalvadorEquatorial GuineaEritreaEstoniaEthiopiaEuro areaEurope & Central AsiaEurope & Central Asia (excluding high income)Europe & Central Asia (IDA & IBRD countries)European UnionFaroe IslandsFijiFinlandFragile and conflict affected situationsFranceFrench PolynesiaGabonGambia, TheGeorgiaGermanyGhanaGreeceGrenadaGuatemalaGuineaGuinea-BissauGuyanaHaitiHeavily indebted poor countries (HIPC)High incomeHondurasHong Kong SAR, ChinaHungaryIBRD onlyIcelandIDA & IBRD totalIDA blendIDA onlyIDA totalIndiaIndonesiaIran, Islamic Rep.IraqIrelandIsraelItalyJamaicaJapanJordanKazakhstanKenyaKiribatiKorea, Rep.KosovoKuwaitKyrgyz RepublicLao PDRLate-demographic dividendLatin America & Caribbean Latin America & Caribbean (excluding high income)Latin America & the Caribbean (IDA & IBRD countries)LatviaLeast developed countries: UN classificationLebanonLesothoLiberiaLibyaLithuaniaLow & middle incomeLow incomeLower middle incomeLuxembourgMacao SAR, ChinaMacedonia, FYRMadagascarMalawiMalaysiaMaldivesMaliMaltaMarshall IslandsMauritaniaMauritiusMexicoMicronesia, Fed. Sts.Middle East & North Africa (excluding high income)Middle East & North Africa (IDA & IBRD countries)Middle incomeMoldovaMongoliaMontenegroMoroccoMozambiqueMyanmarNamibiaNepalNetherlandsNew CaledoniaNew ZealandNicaraguaNigerNigeriaNorth AmericaNorwayOECD membersOmanOther small statesPacific island small statesPakistanPalauPanamaPapua New GuineaParaguayPeruPhilippinesPolandPortugalPost-demographic dividendPre-demographic dividendQatarRomaniaRussian FederationRwandaSamoaSao Tome and PrincipeSaudi ArabiaSenegalSerbiaSeychellesSierra LeoneSingaporeSint Maarten (Dutch part)Slovak RepublicSloveniaSmall statesSolomon IslandsSouth AfricaSouth AsiaSouth Asia (IDA & IBRD)South SudanSpainSri LankaSt. Kitts and NevisSt. LuciaSt. Vincent and the GrenadinesSub-Saharan Africa Sub-Saharan Africa (excluding high income)Sub-Saharan Africa (IDA & IBRD countries)SudanSurinameSwazilandSwedenSwitzerlandSyrian Arab RepublicTajikistanTanzaniaThailandTimor-LesteTogoTongaTrinidad and TobagoTunisiaTurkeyTuvaluUgandaUkraineUnited KingdomUnited StatesUpper middle incomeUruguayVanuatuVenezuela, RBVietnamWest Bank and GazaWorldYemen, Rep.ZambiaZimbabwe La ligne de temps
Cette échelle de temps montre un graphique de 1976 année à 2016 année Botswana. Les données jusqu'à 1975 année ne sont pas présentés. Quantité d'observations actuelles selon dates: 41.
Source (désignation):
Les indicateurs du développement mondiale
Source (organisation):
International Monetary Fund, Balance of Payments Statistics Yearbook and data files.
Catégories:
Economy & Growth, Trade
Dernière mise à jour
23 avr. 2017
Les indicateurs de changement de valeurs selon les années
Minimum:
180.205 mln.
1 janv. 1977
Maximum:
8.205 mds
1 janv. 2014
Pour la date d''observation
Valeur
Changement absolu
Le changement par rapport à la valeur précédente
1 janv. 1976
181.202 mln.
+181.202 mln.
0.0%
1 janv. 1977
180.205 mln.
-996.584 milles
-0.55%
1 janv. 1978
226.377 mln.
+46.172 mln.
25.62%
1 janv. 1979
294.992 mln.
+68.616 mln.
30.31%
1 janv. 1980
442.082 mln.
+147.09 mln.
49.86%
1 janv. 1981
602.528 mln.
+160.446 mln.
36.29%
1 janv. 1982
687.073 mln.
+84.544 mln.
14.03%
1 janv. 1983
579.803 mln.
-107.27 mln.
-15.61%
1 janv. 1984
615.265 mln.
+35.462 mln.
6.12%
1 janv. 1985
583.422 mln.
-31.843 mln.
-5.18%
1 janv. 1986
493.807 mln.
-89.616 mln.
-15.36%
1 janv. 1987
608.415 mln.
+114.609 mln.
23.21%
1 janv. 1988
803.9 mln.
+195.484 mln.
32.13%
1 janv. 1989
986.937 mln.
+183.037 mln.
22.77%
1 janv. 1990
1.185 mds
+198.143 mln.
20.08%
1 janv. 1991
1.611 mds
+425.861 mln.
35.94%
1 janv. 1992
1.604 mds
-6.979 mln.
-0.43%
1 janv. 1993
1.557 mds
-47.361 mln.
-2.95%
1 janv. 1994
1.455 mds
-101.219 mln.
-6.5%
1 janv. 1995
1.364 mds
-91.105 mln.
-6.26%
1 janv. 1996
1.605 mds
+241.159 mln.
17.68%
1 janv. 1997
1.463 mds
-142.173 mln.
-8.86%
1 janv. 1998
1.921 mds
+457.715 mln.
31.28%
1 janv. 1999
1.98 mds
+59.113 mln.
3.08%
1 janv. 2000
1.873 mds
-106.614 mln.
-5.38%
1 janv. 2001
1.773 mds
-100.264 mln.
-5.35%
1 janv. 2002
1.705 mds
-68.671 mln.
-3.87%
1 janv. 2003
1.741 mds
+36.079 mln.
2.12%
1 janv. 2004
2.26 mds
+519.715 mln.
29.86%
1 janv. 2005
3.043 mds
+782.972 mln.
34.64%
1 janv. 2006
2.854 mds
-189.188 mln.
-6.22%
1 janv. 2007
2.78 mds
-73.893 mln.
-2.59%
1 janv. 2008
4.007 mds
+1.227 mds
44.14%
1 janv. 2009
5.175 mds
+1.168 mds
29.14%
1 janv. 2010
4.646 mds
-529.302 mln.
-10.23%
1 janv. 2011
5.599 mds
+952.729 mln.
20.51%
1 janv. 2012
7.14 mds
+1.541 mds
27.52%
1 janv. 2013
8.016 mds
+876.426 mln.
12.28%
1 janv. 2014
8.205 mds
+189.031 mln.
2.36%
1 janv. 2015
7.991 mds
-214.451 mln.
-2.61%
1 janv. 2016
7.09 mds
-900.954 mln.
-11.28%
Classement des pays selon les statistiques actuelles par années


Commentaires: