29
/fr/
fr
AIzaSyAYiBZKx7MnpbEhh9jyipgxe19OcubqV5w
April 1, 2024
193058
Mauritania
MRT
true
2
1
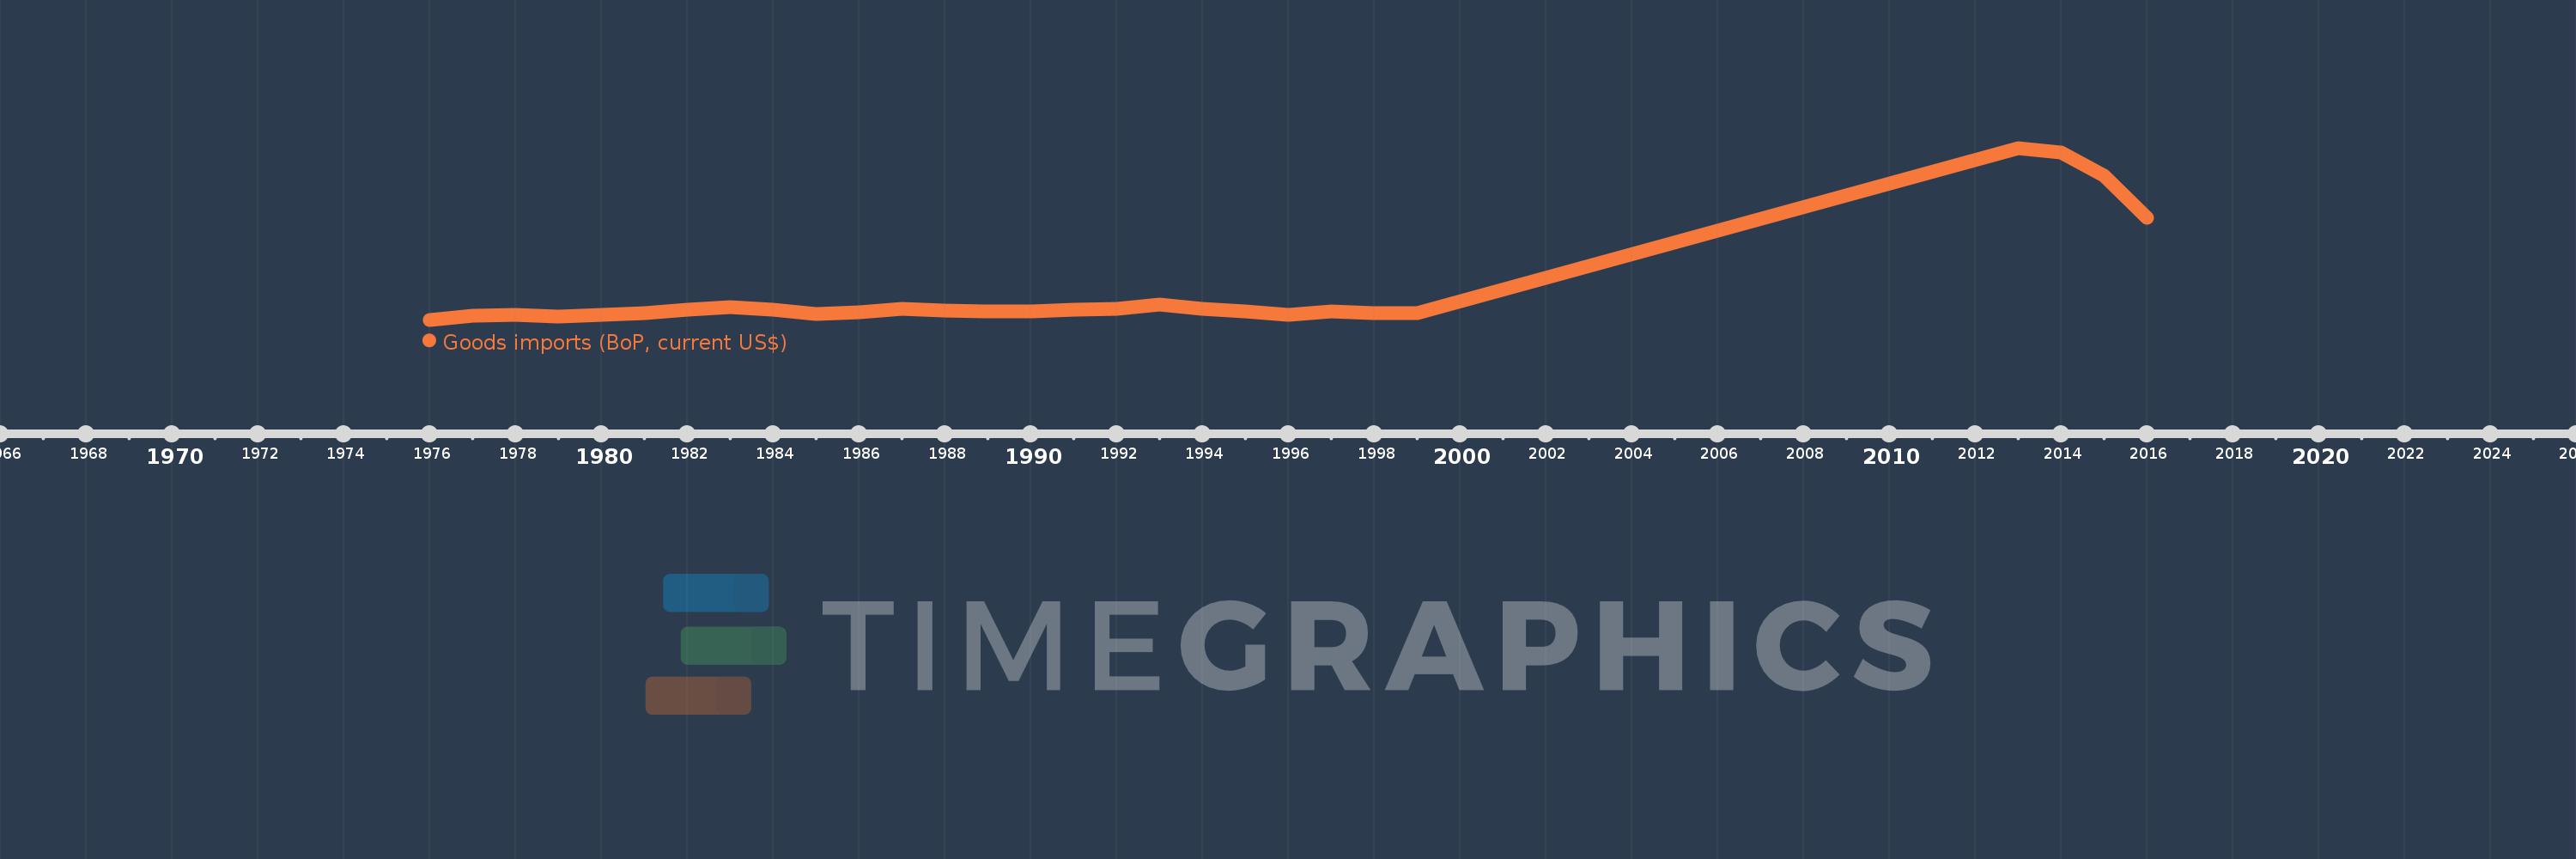
Goods imports (BoP, current US$)
2016,2015,2014,2013,1999,1998,1997,1996,1995,1994,1993,1992,1991,1990,1989,1988,1987,1986,1985,1984,1983,1982,1981,1980,1979,1978,1977,1976
Cette statistique dans les autres pays:
AfghanistanAlbaniaAlgeriaAngolaAntigua and BarbudaArab WorldArgentinaArmeniaArubaAustraliaAustriaAzerbaijanBahamas, TheBahrainBangladeshBarbadosBelarusBelgiumBelizeBeninBermudaBhutanBoliviaBosnia and HerzegovinaBotswanaBrazilBrunei DarussalamBulgariaBurkina FasoBurundiCabo VerdeCambodiaCameroonCanadaCaribbean small statesCentral African RepublicCentral Europe and the BalticsChadChileChinaColombiaComorosCongo, Dem. Rep.Congo, Rep.Costa RicaCote d'IvoireCroatiaCuracaoCyprusCzech RepublicDenmarkDjiboutiDominicaDominican RepublicEarly-demographic dividendEast Asia & PacificEast Asia & Pacific (excluding high income)East Asia & Pacific (IDA & IBRD countries)EcuadorEgypt, Arab Rep.El SalvadorEquatorial GuineaEritreaEstoniaEthiopiaEuro areaEurope & Central AsiaEurope & Central Asia (excluding high income)Europe & Central Asia (IDA & IBRD countries)European UnionFaroe IslandsFijiFinlandFragile and conflict affected situationsFranceFrench PolynesiaGabonGambia, TheGeorgiaGermanyGhanaGreeceGrenadaGuatemalaGuineaGuinea-BissauGuyanaHaitiHeavily indebted poor countries (HIPC)High incomeHondurasHong Kong SAR, ChinaHungaryIBRD onlyIcelandIDA & IBRD totalIDA blendIDA onlyIDA totalIndiaIndonesiaIran, Islamic Rep.IraqIrelandIsraelItalyJamaicaJapanJordanKazakhstanKenyaKiribatiKorea, Rep.KosovoKuwaitKyrgyz RepublicLao PDRLate-demographic dividendLatin America & Caribbean Latin America & Caribbean (excluding high income)Latin America & the Caribbean (IDA & IBRD countries)LatviaLeast developed countries: UN classificationLebanonLesothoLiberiaLibyaLithuaniaLow & middle incomeLow incomeLower middle incomeLuxembourgMacao SAR, ChinaMacedonia, FYRMadagascarMalawiMalaysiaMaldivesMaliMaltaMarshall IslandsMauritaniaMauritiusMexicoMicronesia, Fed. Sts.Middle East & North Africa (excluding high income)Middle East & North Africa (IDA & IBRD countries)Middle incomeMoldovaMongoliaMontenegroMoroccoMozambiqueMyanmarNamibiaNepalNetherlandsNew CaledoniaNew ZealandNicaraguaNigerNigeriaNorth AmericaNorwayOECD membersOmanOther small statesPacific island small statesPakistanPalauPanamaPapua New GuineaParaguayPeruPhilippinesPolandPortugalPost-demographic dividendPre-demographic dividendQatarRomaniaRussian FederationRwandaSamoaSao Tome and PrincipeSaudi ArabiaSenegalSerbiaSeychellesSierra LeoneSingaporeSint Maarten (Dutch part)Slovak RepublicSloveniaSmall statesSolomon IslandsSouth AfricaSouth AsiaSouth Asia (IDA & IBRD)South SudanSpainSri LankaSt. Kitts and NevisSt. LuciaSt. Vincent and the GrenadinesSub-Saharan Africa Sub-Saharan Africa (excluding high income)Sub-Saharan Africa (IDA & IBRD countries)SudanSurinameSwazilandSwedenSwitzerlandSyrian Arab RepublicTajikistanTanzaniaThailandTimor-LesteTogoTongaTrinidad and TobagoTunisiaTurkeyTuvaluUgandaUkraineUnited KingdomUnited StatesUpper middle incomeUruguayVanuatuVenezuela, RBVietnamWest Bank and GazaWorldYemen, Rep.ZambiaZimbabwe La ligne de temps
Cette échelle de temps montre un graphique de 1976 année à 2016 année Mauritania. Les données jusqu'à 1975 année ne sont pas présentés. Quantité d'observations actuelles selon dates: 28.
Source (désignation):
Les indicateurs du développement mondiale
Source (organisation):
International Monetary Fund, Balance of Payments Statistics Yearbook and data files.
Catégories:
Economy & Growth, Trade
Dernière mise à jour
23 avr. 2017
Les indicateurs de changement de valeurs selon les années
Minimum:
208.495 mln.
1 janv. 1976
Maximum:
3.129 mds
1 janv. 2013
Pour la date d''observation
Valeur
Changement absolu
Le changement par rapport à la valeur précédente
1 janv. 1976
208.495 mln.
+208.495 mln.
0.0%
1 janv. 1977
272.021 mln.
+63.527 mln.
30.47%
1 janv. 1978
295.522 mln.
+23.501 mln.
8.64%
1 janv. 1979
267.1 mln.
-28.422 mln.
-9.62%
1 janv. 1980
286.016 mln.
+18.916 mln.
7.08%
1 janv. 1981
321.274 mln.
+35.258 mln.
12.33%
1 janv. 1982
386.224 mln.
+64.95 mln.
20.22%
1 janv. 1983
426.567 mln.
+40.343 mln.
10.45%
1 janv. 1984
378.241 mln.
-48.326 mln.
-11.33%
1 janv. 1985
302.116 mln.
-76.125 mln.
-20.13%
1 janv. 1986
333.904 mln.
+31.788 mln.
10.52%
1 janv. 1987
401.197 mln.
+67.293 mln.
20.15%
1 janv. 1988
359.185 mln.
-42.011 mln.
-10.47%
1 janv. 1989
348.853 mln.
-10.332 mln.
-2.88%
1 janv. 1990
349.328 mln.
+474.09 milles
0.14%
1 janv. 1991
382.91 mln.
+33.583 mln.
9.61%
1 janv. 1992
399.105 mln.
+16.195 mln.
4.23%
1 janv. 1993
461.272 mln.
+62.167 mln.
15.58%
1 janv. 1994
400.37 mln.
-60.902 mln.
-13.2%
1 janv. 1995
352.272 mln.
-48.098 mln.
-12.01%
1 janv. 1996
292.56 mln.
-59.712 mln.
-16.95%
1 janv. 1997
346.104 mln.
+53.544 mln.
18.3%
1 janv. 1998
316.463 mln.
-29.641 mln.
-8.56%
1 janv. 1999
318.667 mln.
+2.204 mln.
0.7%
1 janv. 2013
3.129 mds
+2.81 mds
881.85%
1 janv. 2014
3.044 mds
-84.492 mln.
-2.7%
1 janv. 2015
2.65 mds
-393.931 mln.
-12.94%
1 janv. 2016
1.948 mds
-702.4 mln.
-26.5%
Classement des pays selon les statistiques actuelles par années


Commentaires: