29
/fr/
fr
AIzaSyAYiBZKx7MnpbEhh9jyipgxe19OcubqV5w
April 1, 2024
269364
Turkey
TUR
true
2
1
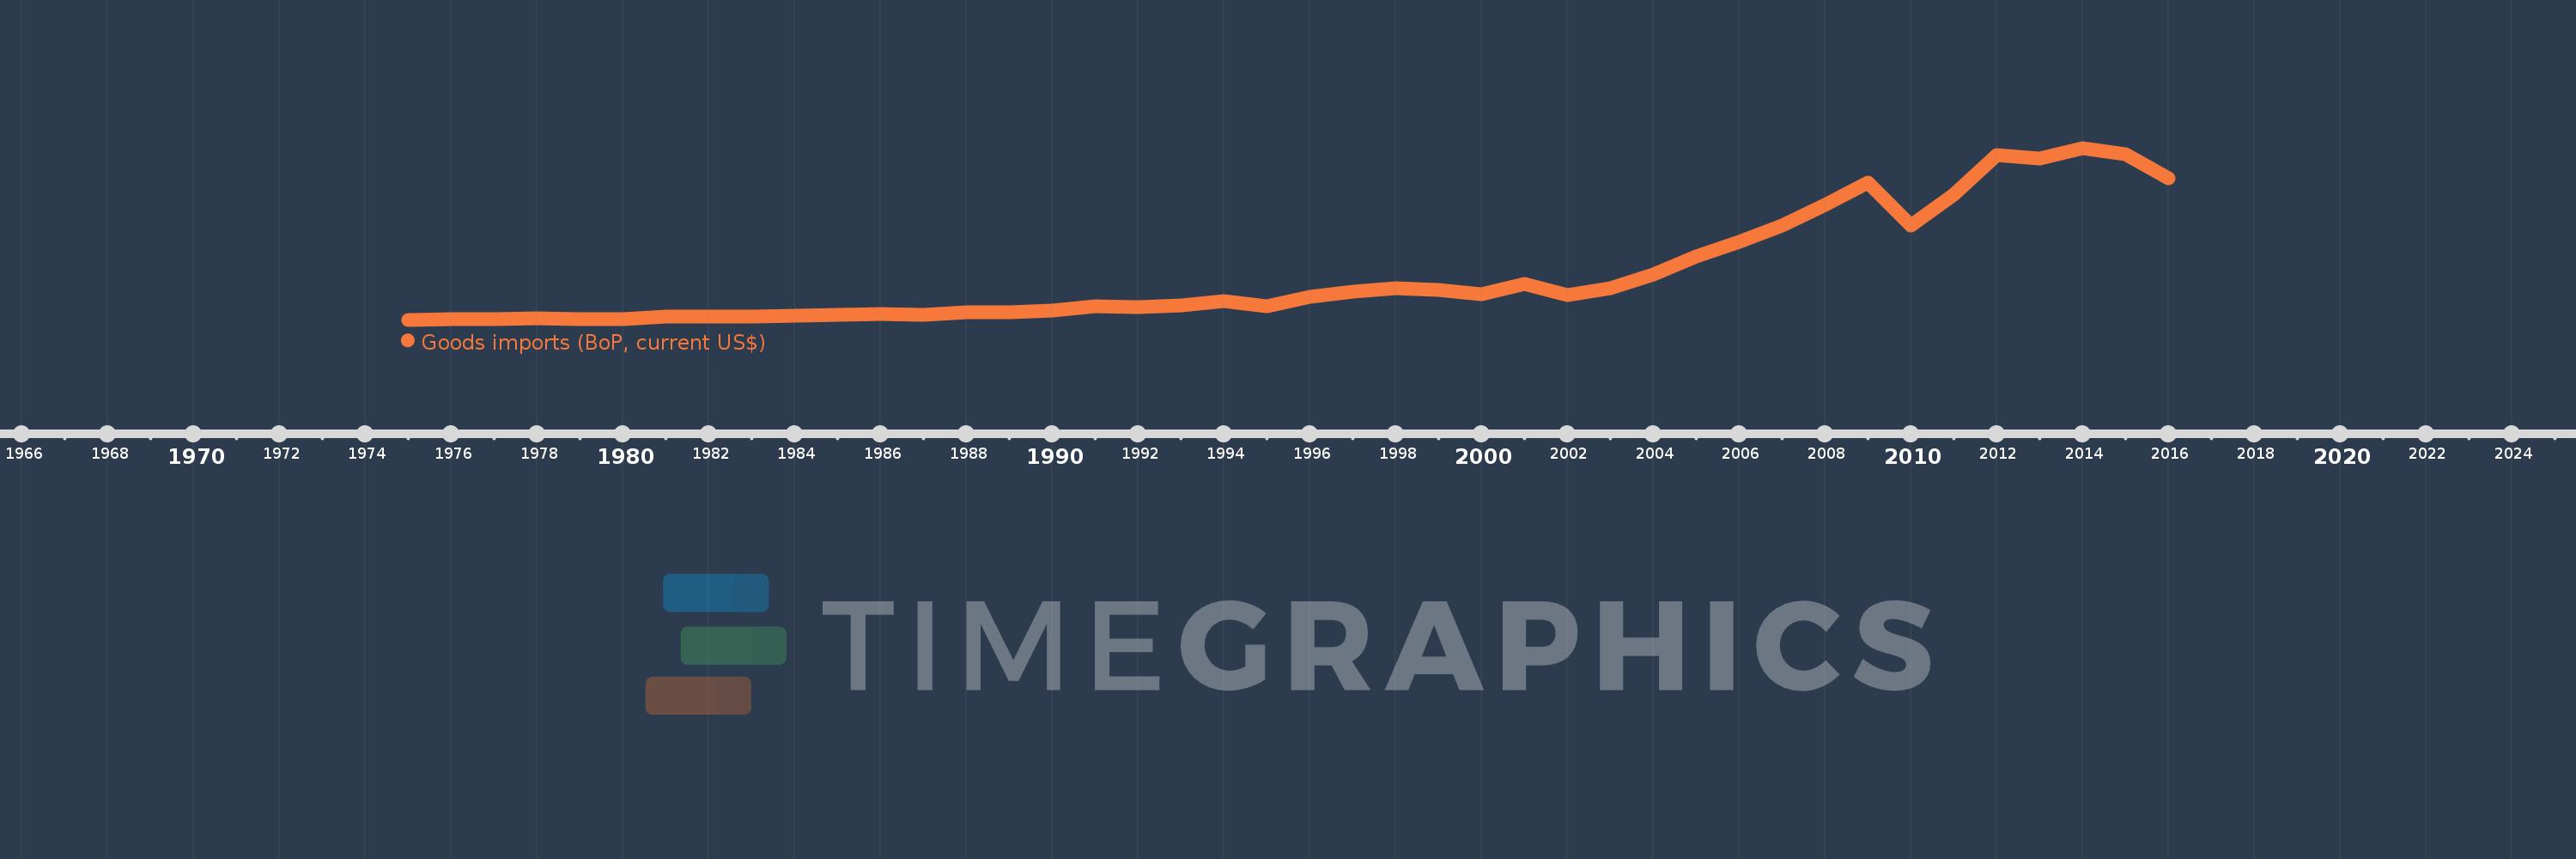
Goods imports (BoP, current US$)
2016,2015,2014,2013,2012,2011,2010,2009,2008,2007,2006,2005,2004,2003,2002,2001,2000,1999,1998,1997,1996,1995,1994,1993,1992,1991,1990,1989,1988,1987,1986,1985,1984,1983,1982,1981,1980,1979,1978,1977,1976,1975
Cette statistique dans les autres pays:
AfghanistanAlbaniaAlgeriaAngolaAntigua and BarbudaArab WorldArgentinaArmeniaArubaAustraliaAustriaAzerbaijanBahamas, TheBahrainBangladeshBarbadosBelarusBelgiumBelizeBeninBermudaBhutanBoliviaBosnia and HerzegovinaBotswanaBrazilBrunei DarussalamBulgariaBurkina FasoBurundiCabo VerdeCambodiaCameroonCanadaCaribbean small statesCentral African RepublicCentral Europe and the BalticsChadChileChinaColombiaComorosCongo, Dem. Rep.Congo, Rep.Costa RicaCote d'IvoireCroatiaCuracaoCyprusCzech RepublicDenmarkDjiboutiDominicaDominican RepublicEarly-demographic dividendEast Asia & PacificEast Asia & Pacific (excluding high income)East Asia & Pacific (IDA & IBRD countries)EcuadorEgypt, Arab Rep.El SalvadorEquatorial GuineaEritreaEstoniaEthiopiaEuro areaEurope & Central AsiaEurope & Central Asia (excluding high income)Europe & Central Asia (IDA & IBRD countries)European UnionFaroe IslandsFijiFinlandFragile and conflict affected situationsFranceFrench PolynesiaGabonGambia, TheGeorgiaGermanyGhanaGreeceGrenadaGuatemalaGuineaGuinea-BissauGuyanaHaitiHeavily indebted poor countries (HIPC)High incomeHondurasHong Kong SAR, ChinaHungaryIBRD onlyIcelandIDA & IBRD totalIDA blendIDA onlyIDA totalIndiaIndonesiaIran, Islamic Rep.IraqIrelandIsraelItalyJamaicaJapanJordanKazakhstanKenyaKiribatiKorea, Rep.KosovoKuwaitKyrgyz RepublicLao PDRLate-demographic dividendLatin America & Caribbean Latin America & Caribbean (excluding high income)Latin America & the Caribbean (IDA & IBRD countries)LatviaLeast developed countries: UN classificationLebanonLesothoLiberiaLibyaLithuaniaLow & middle incomeLow incomeLower middle incomeLuxembourgMacao SAR, ChinaMacedonia, FYRMadagascarMalawiMalaysiaMaldivesMaliMaltaMarshall IslandsMauritaniaMauritiusMexicoMicronesia, Fed. Sts.Middle East & North Africa (excluding high income)Middle East & North Africa (IDA & IBRD countries)Middle incomeMoldovaMongoliaMontenegroMoroccoMozambiqueMyanmarNamibiaNepalNetherlandsNew CaledoniaNew ZealandNicaraguaNigerNigeriaNorth AmericaNorwayOECD membersOmanOther small statesPacific island small statesPakistanPalauPanamaPapua New GuineaParaguayPeruPhilippinesPolandPortugalPost-demographic dividendPre-demographic dividendQatarRomaniaRussian FederationRwandaSamoaSao Tome and PrincipeSaudi ArabiaSenegalSerbiaSeychellesSierra LeoneSingaporeSint Maarten (Dutch part)Slovak RepublicSloveniaSmall statesSolomon IslandsSouth AfricaSouth AsiaSouth Asia (IDA & IBRD)South SudanSpainSri LankaSt. Kitts and NevisSt. LuciaSt. Vincent and the GrenadinesSub-Saharan Africa Sub-Saharan Africa (excluding high income)Sub-Saharan Africa (IDA & IBRD countries)SudanSurinameSwazilandSwedenSwitzerlandSyrian Arab RepublicTajikistanTanzaniaThailandTimor-LesteTogoTongaTrinidad and TobagoTunisiaTurkeyTuvaluUgandaUkraineUnited KingdomUnited StatesUpper middle incomeUruguayVanuatuVenezuela, RBVietnamWest Bank and GazaWorldYemen, Rep.ZambiaZimbabwe La ligne de temps
Cette échelle de temps montre un graphique de 1975 année à 2016 année Turkey. Les données jusqu'à 1974 année ne sont pas présentés. Quantité d'observations actuelles selon dates: 42.
Source (désignation):
Les indicateurs du développement mondiale
Source (organisation):
International Monetary Fund, Balance of Payments Statistics Yearbook and data files.
Catégories:
Economy & Growth, Trade
Dernière mise à jour
23 avr. 2017
Les indicateurs de changement de valeurs selon les années
Minimum:
3.589 mds
1 janv. 1975
Maximum:
241.706 mds
1 janv. 2014
Pour la date d''observation
Valeur
Changement absolu
Le changement par rapport à la valeur précédente
1 janv. 1975
3.589 mds
+3.589 mds
0.0%
1 janv. 1976
4.502 mds
+913.0 mln.
25.44%
1 janv. 1977
4.872 mds
+370.0 mln.
8.22%
1 janv. 1978
5.506 mds
+634.0 mln.
13.01%
1 janv. 1979
4.369 mds
-1.137 mds
-20.65%
1 janv. 1980
4.815 mds
+446.0 mln.
10.21%
1 janv. 1981
7.513 mds
+2.698 mds
56.03%
1 janv. 1982
8.567 mds
+1.054 mds
14.03%
1 janv. 1983
8.518 mds
-49.0 mln.
-0.57%
1 janv. 1984
8.895 mds
+377.0 mln.
4.43%
1 janv. 1985
10.237 mds
+1.342 mds
15.09%
1 janv. 1986
11.162 mds
+925.0 mln.
9.04%
1 janv. 1987
10.58 mds
-582.0 mln.
-5.21%
1 janv. 1988
13.484 mds
+2.904 mds
27.45%
1 janv. 1989
13.636 mds
+152.0 mln.
1.13%
1 janv. 1990
15.891 mds
+2.255 mds
16.54%
1 janv. 1991
22.453 mds
+6.562 mds
41.29%
1 janv. 1992
20.947 mds
-1.506 mds
-6.71%
1 janv. 1993
22.942 mds
+1.995 mds
9.52%
1 janv. 1994
29.655 mds
+6.713 mds
29.26%
1 janv. 1995
22.524 mds
-7.131 mds
-24.05%
1 janv. 1996
35.089 mds
+12.565 mds
55.78%
1 janv. 1997
42.331 mds
+7.242 mds
20.64%
1 janv. 1998
47.158 mds
+4.827 mds
11.4%
1 janv. 1999
44.779 mds
-2.379 mds
-5.04%
1 janv. 2000
38.802 mds
-5.977 mds
-13.35%
1 janv. 2001
52.882 mds
+14.08 mds
36.29%
1 janv. 2002
38.092 mds
-14.79 mds
-27.97%
1 janv. 2003
47.109 mds
+9.017 mds
23.67%
1 janv. 2004
65.883 mds
+18.774 mds
39.85%
1 janv. 2005
91.271 mds
+25.388 mds
38.53%
1 janv. 2006
111.445 mds
+20.174 mds
22.1%
1 janv. 2007
134.672 mds
+23.227 mds
20.84%
1 janv. 2008
162.21 mds
+27.538 mds
20.45%
1 janv. 2009
193.823 mds
+31.613 mds
19.49%
1 janv. 2010
134.494 mds
-59.329 mds
-30.61%
1 janv. 2011
177.317 mds
+42.823 mds
31.84%
1 janv. 2012
231.552 mds
+54.235 mds
30.59%
1 janv. 2013
227.315 mds
-4.237 mds
-1.83%
1 janv. 2014
241.706 mds
+14.391 mds
6.33%
1 janv. 2015
232.523 mds
-9.183 mds
-3.8%
1 janv. 2016
200.127 mds
-32.396 mds
-13.93%
Classement des pays selon les statistiques actuelles par années


Commentaires: